Goertzel Browser [Loxx]As the financial markets become increasingly complex and data-driven, traders and analysts must leverage powerful tools to gain insights and make informed decisions. One such tool is the Goertzel Browser indicator, a sophisticated technical analysis indicator that helps identify cyclical patterns in financial data. This powerful tool is capable of detecting cyclical patterns in financial data, helping traders to make better predictions and optimize their trading strategies. With its unique combination of mathematical algorithms and advanced charting capabilities, this indicator has the potential to revolutionize the way we approach financial modeling and trading.
█ Brief Overview of the Goertzel Browser
The Goertzel Browser is a sophisticated technical analysis tool that utilizes the Goertzel algorithm to analyze and visualize cyclical components within a financial time series. By identifying these cycles and their characteristics, the indicator aims to provide valuable insights into the market's underlying price movements, which could potentially be used for making informed trading decisions.
The primary purpose of this indicator is to:
1. Detect and analyze the dominant cycles present in the price data.
2. Reconstruct and visualize the composite wave based on the detected cycles.
3. Project the composite wave into the future, providing a potential roadmap for upcoming price movements.
To achieve this, the indicator performs several tasks:
1. Detrending the price data: The indicator preprocesses the price data using various detrending techniques, such as Hodrick-Prescott filters, zero-lag moving averages, and linear regression, to remove the underlying trend and focus on the cyclical components.
2. Applying the Goertzel algorithm: The indicator applies the Goertzel algorithm to the detrended price data, identifying the dominant cycles and their characteristics, such as amplitude, phase, and cycle strength.
3. Constructing the composite wave: The indicator reconstructs the composite wave by combining the detected cycles, either by using a user-defined list of cycles or by selecting the top N cycles based on their amplitude or cycle strength.
4. Visualizing the composite wave: The indicator plots the composite wave, using solid lines for the past and dotted lines for the future projections. The color of the lines indicates whether the wave is increasing or decreasing.
5. Displaying cycle information: The indicator provides a table that displays detailed information about the detected cycles, including their rank, period, Bartel's test results, amplitude, and phase.
This indicator is a powerful tool that employs the Goertzel algorithm to analyze and visualize the cyclical components within a financial time series. By providing insights into the underlying price movements and their potential future trajectory, the indicator aims to assist traders in making more informed decisions.
█ What is the Goertzel Algorithm?
The Goertzel algorithm, named after Gerald Goertzel, is a digital signal processing technique that is used to efficiently compute individual terms of the Discrete Fourier Transform (DFT). It was first introduced in 1958, and since then, it has found various applications in the fields of engineering, mathematics, and physics.
The Goertzel algorithm is primarily used to detect specific frequency components within a digital signal, making it particularly useful in applications where only a few frequency components are of interest. The algorithm is computationally efficient, as it requires fewer calculations than the Fast Fourier Transform (FFT) when detecting a small number of frequency components. This efficiency makes the Goertzel algorithm a popular choice in applications such as:
1. Telecommunications: The Goertzel algorithm is used for decoding Dual-Tone Multi-Frequency (DTMF) signals, which are the tones generated when pressing buttons on a telephone keypad. By identifying specific frequency components, the algorithm can accurately determine which button has been pressed.
2. Audio processing: The algorithm can be used to detect specific pitches or harmonics in an audio signal, making it useful in applications like pitch detection and tuning musical instruments.
3. Vibration analysis: In the field of mechanical engineering, the Goertzel algorithm can be applied to analyze vibrations in rotating machinery, helping to identify faulty components or signs of wear.
4. Power system analysis: The algorithm can be used to measure harmonic content in power systems, allowing engineers to assess power quality and detect potential issues.
The Goertzel algorithm is used in these applications because it offers several advantages over other methods, such as the FFT:
1. Computational efficiency: The Goertzel algorithm requires fewer calculations when detecting a small number of frequency components, making it more computationally efficient than the FFT in these cases.
2. Real-time analysis: The algorithm can be implemented in a streaming fashion, allowing for real-time analysis of signals, which is crucial in applications like telecommunications and audio processing.
3. Memory efficiency: The Goertzel algorithm requires less memory than the FFT, as it only computes the frequency components of interest.
4. Precision: The algorithm is less susceptible to numerical errors compared to the FFT, ensuring more accurate results in applications where precision is essential.
The Goertzel algorithm is an efficient digital signal processing technique that is primarily used to detect specific frequency components within a signal. Its computational efficiency, real-time capabilities, and precision make it an attractive choice for various applications, including telecommunications, audio processing, vibration analysis, and power system analysis. The algorithm has been widely adopted since its introduction in 1958 and continues to be an essential tool in the fields of engineering, mathematics, and physics.
█ Goertzel Algorithm in Quantitative Finance: In-Depth Analysis and Applications
The Goertzel algorithm, initially designed for signal processing in telecommunications, has gained significant traction in the financial industry due to its efficient frequency detection capabilities. In quantitative finance, the Goertzel algorithm has been utilized for uncovering hidden market cycles, developing data-driven trading strategies, and optimizing risk management. This section delves deeper into the applications of the Goertzel algorithm in finance, particularly within the context of quantitative trading and analysis.
Unveiling Hidden Market Cycles:
Market cycles are prevalent in financial markets and arise from various factors, such as economic conditions, investor psychology, and market participant behavior. The Goertzel algorithm's ability to detect and isolate specific frequencies in price data helps trader analysts identify hidden market cycles that may otherwise go unnoticed. By examining the amplitude, phase, and periodicity of each cycle, traders can better understand the underlying market structure and dynamics, enabling them to develop more informed and effective trading strategies.
Developing Quantitative Trading Strategies:
The Goertzel algorithm's versatility allows traders to incorporate its insights into a wide range of trading strategies. By identifying the dominant market cycles in a financial instrument's price data, traders can create data-driven strategies that capitalize on the cyclical nature of markets.
For instance, a trader may develop a mean-reversion strategy that takes advantage of the identified cycles. By establishing positions when the price deviates from the predicted cycle, the trader can profit from the subsequent reversion to the cycle's mean. Similarly, a momentum-based strategy could be designed to exploit the persistence of a dominant cycle by entering positions that align with the cycle's direction.
Enhancing Risk Management:
The Goertzel algorithm plays a vital role in risk management for quantitative strategies. By analyzing the cyclical components of a financial instrument's price data, traders can gain insights into the potential risks associated with their trading strategies.
By monitoring the amplitude and phase of dominant cycles, a trader can detect changes in market dynamics that may pose risks to their positions. For example, a sudden increase in amplitude may indicate heightened volatility, prompting the trader to adjust position sizing or employ hedging techniques to protect their portfolio. Additionally, changes in phase alignment could signal a potential shift in market sentiment, necessitating adjustments to the trading strategy.
Expanding Quantitative Toolkits:
Traders can augment the Goertzel algorithm's insights by combining it with other quantitative techniques, creating a more comprehensive and sophisticated analysis framework. For example, machine learning algorithms, such as neural networks or support vector machines, could be trained on features extracted from the Goertzel algorithm to predict future price movements more accurately.
Furthermore, the Goertzel algorithm can be integrated with other technical analysis tools, such as moving averages or oscillators, to enhance their effectiveness. By applying these tools to the identified cycles, traders can generate more robust and reliable trading signals.
The Goertzel algorithm offers invaluable benefits to quantitative finance practitioners by uncovering hidden market cycles, aiding in the development of data-driven trading strategies, and improving risk management. By leveraging the insights provided by the Goertzel algorithm and integrating it with other quantitative techniques, traders can gain a deeper understanding of market dynamics and devise more effective trading strategies.
█ Indicator Inputs
src: This is the source data for the analysis, typically the closing price of the financial instrument.
detrendornot: This input determines the method used for detrending the source data. Detrending is the process of removing the underlying trend from the data to focus on the cyclical components.
The available options are:
hpsmthdt: Detrend using Hodrick-Prescott filter centered moving average.
zlagsmthdt: Detrend using zero-lag moving average centered moving average.
logZlagRegression: Detrend using logarithmic zero-lag linear regression.
hpsmth: Detrend using Hodrick-Prescott filter.
zlagsmth: Detrend using zero-lag moving average.
DT_HPper1 and DT_HPper2: These inputs define the period range for the Hodrick-Prescott filter centered moving average when detrendornot is set to hpsmthdt.
DT_ZLper1 and DT_ZLper2: These inputs define the period range for the zero-lag moving average centered moving average when detrendornot is set to zlagsmthdt.
DT_RegZLsmoothPer: This input defines the period for the zero-lag moving average used in logarithmic zero-lag linear regression when detrendornot is set to logZlagRegression.
HPsmoothPer: This input defines the period for the Hodrick-Prescott filter when detrendornot is set to hpsmth.
ZLMAsmoothPer: This input defines the period for the zero-lag moving average when detrendornot is set to zlagsmth.
MaxPer: This input sets the maximum period for the Goertzel algorithm to search for cycles.
squaredAmp: This boolean input determines whether the amplitude should be squared in the Goertzel algorithm.
useAddition: This boolean input determines whether the Goertzel algorithm should use addition for combining the cycles.
useCosine: This boolean input determines whether the Goertzel algorithm should use cosine waves instead of sine waves.
UseCycleStrength: This boolean input determines whether the Goertzel algorithm should compute the cycle strength, which is a normalized measure of the cycle's amplitude.
WindowSizePast and WindowSizeFuture: These inputs define the window size for past and future projections of the composite wave.
FilterBartels: This boolean input determines whether Bartel's test should be applied to filter out non-significant cycles.
BartNoCycles: This input sets the number of cycles to be used in Bartel's test.
BartSmoothPer: This input sets the period for the moving average used in Bartel's test.
BartSigLimit: This input sets the significance limit for Bartel's test, below which cycles are considered insignificant.
SortBartels: This boolean input determines whether the cycles should be sorted by their Bartel's test results.
UseCycleList: This boolean input determines whether a user-defined list of cycles should be used for constructing the composite wave. If set to false, the top N cycles will be used.
Cycle1, Cycle2, Cycle3, Cycle4, and Cycle5: These inputs define the user-defined list of cycles when 'UseCycleList' is set to true. If using a user-defined list, each of these inputs represents the period of a specific cycle to include in the composite wave.
StartAtCycle: This input determines the starting index for selecting the top N cycles when UseCycleList is set to false. This allows you to skip a certain number of cycles from the top before selecting the desired number of cycles.
UseTopCycles: This input sets the number of top cycles to use for constructing the composite wave when UseCycleList is set to false. The cycles are ranked based on their amplitudes or cycle strengths, depending on the UseCycleStrength input.
SubtractNoise: This boolean input determines whether to subtract the noise (remaining cycles) from the composite wave. If set to true, the composite wave will only include the top N cycles specified by UseTopCycles.
█ Exploring Auxiliary Functions
The following functions demonstrate advanced techniques for analyzing financial markets, including zero-lag moving averages, Bartels probability, detrending, and Hodrick-Prescott filtering. This section examines each function in detail, explaining their purpose, methodology, and applications in finance. We will examine how each function contributes to the overall performance and effectiveness of the indicator and how they work together to create a powerful analytical tool.
Zero-Lag Moving Average:
The zero-lag moving average function is designed to minimize the lag typically associated with moving averages. This is achieved through a two-step weighted linear regression process that emphasizes more recent data points. The function calculates a linearly weighted moving average (LWMA) on the input data and then applies another LWMA on the result. By doing this, the function creates a moving average that closely follows the price action, reducing the lag and improving the responsiveness of the indicator.
The zero-lag moving average function is used in the indicator to provide a responsive, low-lag smoothing of the input data. This function helps reduce the noise and fluctuations in the data, making it easier to identify and analyze underlying trends and patterns. By minimizing the lag associated with traditional moving averages, this function allows the indicator to react more quickly to changes in market conditions, providing timely signals and improving the overall effectiveness of the indicator.
Bartels Probability:
The Bartels probability function calculates the probability of a given cycle being significant in a time series. It uses a mathematical test called the Bartels test to assess the significance of cycles detected in the data. The function calculates coefficients for each detected cycle and computes an average amplitude and an expected amplitude. By comparing these values, the Bartels probability is derived, indicating the likelihood of a cycle's significance. This information can help in identifying and analyzing dominant cycles in financial markets.
The Bartels probability function is incorporated into the indicator to assess the significance of detected cycles in the input data. By calculating the Bartels probability for each cycle, the indicator can prioritize the most significant cycles and focus on the market dynamics that are most relevant to the current trading environment. This function enhances the indicator's ability to identify dominant market cycles, improving its predictive power and aiding in the development of effective trading strategies.
Detrend Logarithmic Zero-Lag Regression:
The detrend logarithmic zero-lag regression function is used for detrending data while minimizing lag. It combines a zero-lag moving average with a linear regression detrending method. The function first calculates the zero-lag moving average of the logarithm of input data and then applies a linear regression to remove the trend. By detrending the data, the function isolates the cyclical components, making it easier to analyze and interpret the underlying market dynamics.
The detrend logarithmic zero-lag regression function is used in the indicator to isolate the cyclical components of the input data. By detrending the data, the function enables the indicator to focus on the cyclical movements in the market, making it easier to analyze and interpret market dynamics. This function is essential for identifying cyclical patterns and understanding the interactions between different market cycles, which can inform trading decisions and enhance overall market understanding.
Bartels Cycle Significance Test:
The Bartels cycle significance test is a function that combines the Bartels probability function and the detrend logarithmic zero-lag regression function to assess the significance of detected cycles. The function calculates the Bartels probability for each cycle and stores the results in an array. By analyzing the probability values, traders and analysts can identify the most significant cycles in the data, which can be used to develop trading strategies and improve market understanding.
The Bartels cycle significance test function is integrated into the indicator to provide a comprehensive analysis of the significance of detected cycles. By combining the Bartels probability function and the detrend logarithmic zero-lag regression function, this test evaluates the significance of each cycle and stores the results in an array. The indicator can then use this information to prioritize the most significant cycles and focus on the most relevant market dynamics. This function enhances the indicator's ability to identify and analyze dominant market cycles, providing valuable insights for trading and market analysis.
Hodrick-Prescott Filter:
The Hodrick-Prescott filter is a popular technique used to separate the trend and cyclical components of a time series. The function applies a smoothing parameter to the input data and calculates a smoothed series using a two-sided filter. This smoothed series represents the trend component, which can be subtracted from the original data to obtain the cyclical component. The Hodrick-Prescott filter is commonly used in economics and finance to analyze economic data and financial market trends.
The Hodrick-Prescott filter is incorporated into the indicator to separate the trend and cyclical components of the input data. By applying the filter to the data, the indicator can isolate the trend component, which can be used to analyze long-term market trends and inform trading decisions. Additionally, the cyclical component can be used to identify shorter-term market dynamics and provide insights into potential trading opportunities. The inclusion of the Hodrick-Prescott filter adds another layer of analysis to the indicator, making it more versatile and comprehensive.
Detrending Options: Detrend Centered Moving Average:
The detrend centered moving average function provides different detrending methods, including the Hodrick-Prescott filter and the zero-lag moving average, based on the selected detrending method. The function calculates two sets of smoothed values using the chosen method and subtracts one set from the other to obtain a detrended series. By offering multiple detrending options, this function allows traders and analysts to select the most appropriate method for their specific needs and preferences.
The detrend centered moving average function is integrated into the indicator to provide users with multiple detrending options, including the Hodrick-Prescott filter and the zero-lag moving average. By offering multiple detrending methods, the indicator allows users to customize the analysis to their specific needs and preferences, enhancing the indicator's overall utility and adaptability. This function ensures that the indicator can cater to a wide range of trading styles and objectives, making it a valuable tool for a diverse group of market participants.
The auxiliary functions functions discussed in this section demonstrate the power and versatility of mathematical techniques in analyzing financial markets. By understanding and implementing these functions, traders and analysts can gain valuable insights into market dynamics, improve their trading strategies, and make more informed decisions. The combination of zero-lag moving averages, Bartels probability, detrending methods, and the Hodrick-Prescott filter provides a comprehensive toolkit for analyzing and interpreting financial data. The integration of advanced functions in a financial indicator creates a powerful and versatile analytical tool that can provide valuable insights into financial markets. By combining the zero-lag moving average,
█ In-Depth Analysis of the Goertzel Browser Code
The Goertzel Browser code is an implementation of the Goertzel Algorithm, an efficient technique to perform spectral analysis on a signal. The code is designed to detect and analyze dominant cycles within a given financial market data set. This section will provide an extremely detailed explanation of the code, its structure, functions, and intended purpose.
Function signature and input parameters:
The Goertzel Browser function accepts numerous input parameters for customization, including source data (src), the current bar (forBar), sample size (samplesize), period (per), squared amplitude flag (squaredAmp), addition flag (useAddition), cosine flag (useCosine), cycle strength flag (UseCycleStrength), past and future window sizes (WindowSizePast, WindowSizeFuture), Bartels filter flag (FilterBartels), Bartels-related parameters (BartNoCycles, BartSmoothPer, BartSigLimit), sorting flag (SortBartels), and output buffers (goeWorkPast, goeWorkFuture, cyclebuffer, amplitudebuffer, phasebuffer, cycleBartelsBuffer).
Initializing variables and arrays:
The code initializes several float arrays (goeWork1, goeWork2, goeWork3, goeWork4) with the same length as twice the period (2 * per). These arrays store intermediate results during the execution of the algorithm.
Preprocessing input data:
The input data (src) undergoes preprocessing to remove linear trends. This step enhances the algorithm's ability to focus on cyclical components in the data. The linear trend is calculated by finding the slope between the first and last values of the input data within the sample.
Iterative calculation of Goertzel coefficients:
The core of the Goertzel Browser algorithm lies in the iterative calculation of Goertzel coefficients for each frequency bin. These coefficients represent the spectral content of the input data at different frequencies. The code iterates through the range of frequencies, calculating the Goertzel coefficients using a nested loop structure.
Cycle strength computation:
The code calculates the cycle strength based on the Goertzel coefficients. This is an optional step, controlled by the UseCycleStrength flag. The cycle strength provides information on the relative influence of each cycle on the data per bar, considering both amplitude and cycle length. The algorithm computes the cycle strength either by squaring the amplitude (controlled by squaredAmp flag) or using the actual amplitude values.
Phase calculation:
The Goertzel Browser code computes the phase of each cycle, which represents the position of the cycle within the input data. The phase is calculated using the arctangent function (math.atan) based on the ratio of the imaginary and real components of the Goertzel coefficients.
Peak detection and cycle extraction:
The algorithm performs peak detection on the computed amplitudes or cycle strengths to identify dominant cycles. It stores the detected cycles in the cyclebuffer array, along with their corresponding amplitudes and phases in the amplitudebuffer and phasebuffer arrays, respectively.
Sorting cycles by amplitude or cycle strength:
The code sorts the detected cycles based on their amplitude or cycle strength in descending order. This allows the algorithm to prioritize cycles with the most significant impact on the input data.
Bartels cycle significance test:
If the FilterBartels flag is set, the code performs a Bartels cycle significance test on the detected cycles. This test determines the statistical significance of each cycle and filters out the insignificant cycles. The significant cycles are stored in the cycleBartelsBuffer array. If the SortBartels flag is set, the code sorts the significant cycles based on their Bartels significance values.
Waveform calculation:
The Goertzel Browser code calculates the waveform of the significant cycles for both past and future time windows. The past and future windows are defined by the WindowSizePast and WindowSizeFuture parameters, respectively. The algorithm uses either cosine or sine functions (controlled by the useCosine flag) to calculate the waveforms for each cycle. The useAddition flag determines whether the waveforms should be added or subtracted.
Storing waveforms in matrices:
The calculated waveforms for each cycle are stored in two matrices - goeWorkPast and goeWorkFuture. These matrices hold the waveforms for the past and future time windows, respectively. Each row in the matrices represents a time window position, and each column corresponds to a cycle.
Returning the number of cycles:
The Goertzel Browser function returns the total number of detected cycles (number_of_cycles) after processing the input data. This information can be used to further analyze the results or to visualize the detected cycles.
The Goertzel Browser code is a comprehensive implementation of the Goertzel Algorithm, specifically designed for detecting and analyzing dominant cycles within financial market data. The code offers a high level of customization, allowing users to fine-tune the algorithm based on their specific needs. The Goertzel Browser's combination of preprocessing, iterative calculations, cycle extraction, sorting, significance testing, and waveform calculation makes it a powerful tool for understanding cyclical components in financial data.
█ Generating and Visualizing Composite Waveform
The indicator calculates and visualizes the composite waveform for both past and future time windows based on the detected cycles. Here's a detailed explanation of this process:
Updating WindowSizePast and WindowSizeFuture:
The WindowSizePast and WindowSizeFuture are updated to ensure they are at least twice the MaxPer (maximum period).
Initializing matrices and arrays:
Two matrices, goeWorkPast and goeWorkFuture, are initialized to store the Goertzel results for past and future time windows. Multiple arrays are also initialized to store cycle, amplitude, phase, and Bartels information.
Preparing the source data (srcVal) array:
The source data is copied into an array, srcVal, and detrended using one of the selected methods (hpsmthdt, zlagsmthdt, logZlagRegression, hpsmth, or zlagsmth).
Goertzel function call:
The Goertzel function is called to analyze the detrended source data and extract cycle information. The output, number_of_cycles, contains the number of detected cycles.
Initializing arrays for past and future waveforms:
Three arrays, epgoertzel, goertzel, and goertzelFuture, are initialized to store the endpoint Goertzel, non-endpoint Goertzel, and future Goertzel projections, respectively.
Calculating composite waveform for past bars (goertzel array):
The past composite waveform is calculated by summing the selected cycles (either from the user-defined cycle list or the top cycles) and optionally subtracting the noise component.
Calculating composite waveform for future bars (goertzelFuture array):
The future composite waveform is calculated in a similar way as the past composite waveform.
Drawing past composite waveform (pvlines):
The past composite waveform is drawn on the chart using solid lines. The color of the lines is determined by the direction of the waveform (green for upward, red for downward).
Drawing future composite waveform (fvlines):
The future composite waveform is drawn on the chart using dotted lines. The color of the lines is determined by the direction of the waveform (fuchsia for upward, yellow for downward).
Displaying cycle information in a table (table3):
A table is created to display the cycle information, including the rank, period, Bartel value, amplitude (or cycle strength), and phase of each detected cycle.
Filling the table with cycle information:
The indicator iterates through the detected cycles and retrieves the relevant information (period, amplitude, phase, and Bartel value) from the corresponding arrays. It then fills the table with this information, displaying the values up to six decimal places.
To summarize, this indicator generates a composite waveform based on the detected cycles in the financial data. It calculates the composite waveforms for both past and future time windows and visualizes them on the chart using colored lines. Additionally, it displays detailed cycle information in a table, including the rank, period, Bartel value, amplitude (or cycle strength), and phase of each detected cycle.
█ Enhancing the Goertzel Algorithm-Based Script for Financial Modeling and Trading
The Goertzel algorithm-based script for detecting dominant cycles in financial data is a powerful tool for financial modeling and trading. It provides valuable insights into the past behavior of these cycles and potential future impact. However, as with any algorithm, there is always room for improvement. This section discusses potential enhancements to the existing script to make it even more robust and versatile for financial modeling, general trading, advanced trading, and high-frequency finance trading.
Enhancements for Financial Modeling
Data preprocessing: One way to improve the script's performance for financial modeling is to introduce more advanced data preprocessing techniques. This could include removing outliers, handling missing data, and normalizing the data to ensure consistent and accurate results.
Additional detrending and smoothing methods: Incorporating more sophisticated detrending and smoothing techniques, such as wavelet transform or empirical mode decomposition, can help improve the script's ability to accurately identify cycles and trends in the data.
Machine learning integration: Integrating machine learning techniques, such as artificial neural networks or support vector machines, can help enhance the script's predictive capabilities, leading to more accurate financial models.
Enhancements for General and Advanced Trading
Customizable indicator integration: Allowing users to integrate their own technical indicators can help improve the script's effectiveness for both general and advanced trading. By enabling the combination of the dominant cycle information with other technical analysis tools, traders can develop more comprehensive trading strategies.
Risk management and position sizing: Incorporating risk management and position sizing functionality into the script can help traders better manage their trades and control potential losses. This can be achieved by calculating the optimal position size based on the user's risk tolerance and account size.
Multi-timeframe analysis: Enhancing the script to perform multi-timeframe analysis can provide traders with a more holistic view of market trends and cycles. By identifying dominant cycles on different timeframes, traders can gain insights into the potential confluence of cycles and make better-informed trading decisions.
Enhancements for High-Frequency Finance Trading
Algorithm optimization: To ensure the script's suitability for high-frequency finance trading, optimizing the algorithm for faster execution is crucial. This can be achieved by employing efficient data structures and refining the calculation methods to minimize computational complexity.
Real-time data streaming: Integrating real-time data streaming capabilities into the script can help high-frequency traders react to market changes more quickly. By continuously updating the cycle information based on real-time market data, traders can adapt their strategies accordingly and capitalize on short-term market fluctuations.
Order execution and trade management: To fully leverage the script's capabilities for high-frequency trading, implementing functionality for automated order execution and trade management is essential. This can include features such as stop-loss and take-profit orders, trailing stops, and automated trade exit strategies.
While the existing Goertzel algorithm-based script is a valuable tool for detecting dominant cycles in financial data, there are several potential enhancements that can make it even more powerful for financial modeling, general trading, advanced trading, and high-frequency finance trading. By incorporating these improvements, the script can become a more versatile and effective tool for traders and financial analysts alike.
█ Understanding the Limitations of the Goertzel Algorithm
While the Goertzel algorithm-based script for detecting dominant cycles in financial data provides valuable insights, it is important to be aware of its limitations and drawbacks. Some of the key drawbacks of this indicator are:
Lagging nature:
As with many other technical indicators, the Goertzel algorithm-based script can suffer from lagging effects, meaning that it may not immediately react to real-time market changes. This lag can lead to late entries and exits, potentially resulting in reduced profitability or increased losses.
Parameter sensitivity:
The performance of the script can be sensitive to the chosen parameters, such as the detrending methods, smoothing techniques, and cycle detection settings. Improper parameter selection may lead to inaccurate cycle detection or increased false signals, which can negatively impact trading performance.
Complexity:
The Goertzel algorithm itself is relatively complex, making it difficult for novice traders or those unfamiliar with the concept of cycle analysis to fully understand and effectively utilize the script. This complexity can also make it challenging to optimize the script for specific trading styles or market conditions.
Overfitting risk:
As with any data-driven approach, there is a risk of overfitting when using the Goertzel algorithm-based script. Overfitting occurs when a model becomes too specific to the historical data it was trained on, leading to poor performance on new, unseen data. This can result in misleading signals and reduced trading performance.
No guarantee of future performance: While the script can provide insights into past cycles and potential future trends, it is important to remember that past performance does not guarantee future results. Market conditions can change, and relying solely on the script's predictions without considering other factors may lead to poor trading decisions.
Limited applicability: The Goertzel algorithm-based script may not be suitable for all markets, trading styles, or timeframes. Its effectiveness in detecting cycles may be limited in certain market conditions, such as during periods of extreme volatility or low liquidity.
While the Goertzel algorithm-based script offers valuable insights into dominant cycles in financial data, it is essential to consider its drawbacks and limitations when incorporating it into a trading strategy. Traders should always use the script in conjunction with other technical and fundamental analysis tools, as well as proper risk management, to make well-informed trading decisions.
█ Interpreting Results
The Goertzel Browser indicator can be interpreted by analyzing the plotted lines and the table presented alongside them. The indicator plots two lines: past and future composite waves. The past composite wave represents the composite wave of the past price data, and the future composite wave represents the projected composite wave for the next period.
The past composite wave line displays a solid line, with green indicating a bullish trend and red indicating a bearish trend. On the other hand, the future composite wave line is a dotted line with fuchsia indicating a bullish trend and yellow indicating a bearish trend.
The table presented alongside the indicator shows the top cycles with their corresponding rank, period, Bartels, amplitude or cycle strength, and phase. The amplitude is a measure of the strength of the cycle, while the phase is the position of the cycle within the data series.
Interpreting the Goertzel Browser indicator involves identifying the trend of the past and future composite wave lines and matching them with the corresponding bullish or bearish color. Additionally, traders can identify the top cycles with the highest amplitude or cycle strength and utilize them in conjunction with other technical indicators and fundamental analysis for trading decisions.
This indicator is considered a repainting indicator because the value of the indicator is calculated based on the past price data. As new price data becomes available, the indicator's value is recalculated, potentially causing the indicator's past values to change. This can create a false impression of the indicator's performance, as it may appear to have provided a profitable trading signal in the past when, in fact, that signal did not exist at the time.
The Goertzel indicator is also non-endpointed, meaning that it is not calculated up to the current bar or candle. Instead, it uses a fixed amount of historical data to calculate its values, which can make it difficult to use for real-time trading decisions. For example, if the indicator uses 100 bars of historical data to make its calculations, it cannot provide a signal until the current bar has closed and become part of the historical data. This can result in missed trading opportunities or delayed signals.
█ Conclusion
The Goertzel Browser indicator is a powerful tool for identifying and analyzing cyclical patterns in financial markets. Its ability to detect multiple cycles of varying frequencies and strengths make it a valuable addition to any trader's technical analysis toolkit. However, it is important to keep in mind that the Goertzel Browser indicator should be used in conjunction with other technical analysis tools and fundamental analysis to achieve the best results. With continued refinement and development, the Goertzel Browser indicator has the potential to become a highly effective tool for financial modeling, general trading, advanced trading, and high-frequency finance trading. Its accuracy and versatility make it a promising candidate for further research and development.
█ Footnotes
What is the Bartels Test for Cycle Significance?
The Bartels Cycle Significance Test is a statistical method that determines whether the peaks and troughs of a time series are statistically significant. The test is named after its inventor, George Bartels, who developed it in the mid-20th century.
The Bartels test is designed to analyze the cyclical components of a time series, which can help traders and analysts identify trends and cycles in financial markets. The test calculates a Bartels statistic, which measures the degree of non-randomness or autocorrelation in the time series.
The Bartels statistic is calculated by first splitting the time series into two halves and calculating the range of the peaks and troughs in each half. The test then compares these ranges using a t-test, which measures the significance of the difference between the two ranges.
If the Bartels statistic is greater than a critical value, it indicates that the peaks and troughs in the time series are non-random and that there is a significant cyclical component to the data. Conversely, if the Bartels statistic is less than the critical value, it suggests that the peaks and troughs are random and that there is no significant cyclical component.
The Bartels Cycle Significance Test is particularly useful in financial analysis because it can help traders and analysts identify significant cycles in asset prices, which can in turn inform investment decisions. However, it is important to note that the test is not perfect and can produce false signals in certain situations, particularly in noisy or volatile markets. Therefore, it is always recommended to use the test in conjunction with other technical and fundamental indicators to confirm trends and cycles.
Deep-dive into the Hodrick-Prescott Fitler
The Hodrick-Prescott (HP) filter is a statistical tool used in economics and finance to separate a time series into two components: a trend component and a cyclical component. It is a powerful tool for identifying long-term trends in economic and financial data and is widely used by economists, central banks, and financial institutions around the world.
The HP filter was first introduced in the 1990s by economists Robert Hodrick and Edward Prescott. It is a simple, two-parameter filter that separates a time series into a trend component and a cyclical component. The trend component represents the long-term behavior of the data, while the cyclical component captures the shorter-term fluctuations around the trend.
The HP filter works by minimizing the following objective function:
Minimize: (Sum of Squared Deviations) + λ (Sum of Squared Second Differences)
Where:
The first term represents the deviation of the data from the trend.
The second term represents the smoothness of the trend.
λ is a smoothing parameter that determines the degree of smoothness of the trend.
The smoothing parameter λ is typically set to a value between 100 and 1600, depending on the frequency of the data. Higher values of λ lead to a smoother trend, while lower values lead to a more volatile trend.
The HP filter has several advantages over other smoothing techniques. It is a non-parametric method, meaning that it does not make any assumptions about the underlying distribution of the data. It also allows for easy comparison of trends across different time series and can be used with data of any frequency.
However, the HP filter also has some limitations. It assumes that the trend is a smooth function, which may not be the case in some situations. It can also be sensitive to changes in the smoothing parameter λ, which may result in different trends for the same data. Additionally, the filter may produce unrealistic trends for very short time series.
Despite these limitations, the HP filter remains a valuable tool for analyzing economic and financial data. It is widely used by central banks and financial institutions to monitor long-term trends in the economy, and it can be used to identify turning points in the business cycle. The filter can also be used to analyze asset prices, exchange rates, and other financial variables.
The Hodrick-Prescott filter is a powerful tool for analyzing economic and financial data. It separates a time series into a trend component and a cyclical component, allowing for easy identification of long-term trends and turning points in the business cycle. While it has some limitations, it remains a valuable tool for economists, central banks, and financial institutions around the world.
"the script" için komut dosyalarını ara

Nifty and Bank Nifty Dashboard V2This shows a performance glance of Dow and major Constituents of NSE:NIFTY or NSE:BANKNIFTY . This is an enhancement to the Bank nifty dashboard published earlier.
Usage
• Customizable Table and Style settings
• Customizable Indicator Settings
• Customizable Time frame of Indicators in Table. Can change to higher or lower TF other than the chart time frame
• Customizable Input symbols. Can modify with the Scripts you want to track.
• The Last row will be the current script viewed in charts.
• Can enable or disable indicators on the chart like ST, SMA, VWAP.
• Strong Volume Indication at bottom based on the average volume inputs for Nifty, Bank Nifty and for other stocks volume > 20 ma(volume)
• Displays bank nifty stocks if Bank nifty is the open chart else it will display top Nifty Stocks.
• This will help to monitor the performance of various scripts.
• Can change the stock list according to usage/Index.
• It will show all the symbols if Additional Symbols is selected.
Buy-Sell Signal
• Volume > Average Volume, it Shows #
• ST – Buy - Price > Super trend (10,2) and vice versa
• SMA – Buy - Price > MA and vice versa
• RSI – Buy – RSI > 50, Sell – RSI < 40
• ADX: Buy - ADX > 25, DMI+ Above DMI - and vice versa
• Previous day High low is not considered for buy or sell score calculation. This is just for additional observation.
• ATR will be highlighted when change > 0.75 of the average true range of daily price.
Strong colours will be shown for respective boxes when some additional conditions satisfy.
Style settings
Dashboard Location: Location of the dashboard on the chart
Dashboard Size: The size of the dashboard on the chart
Text/Frame Color: Determines the colour of the frame grid as well as the text colour
Bullish Cell Color: Determines the colour of cell associated with a rising indicator direction
Bearish Cell Color: Determines the colour of cell associated with a decreasing indicator direction
Cell Transparency: Transparency of each cell

Perfect zonesAs the name says this script will be perfect.
There are 2 types of indicators in the market. Leading and Lagging.
I always prefer to choose a leading which can help me determine my trades future hand.
This script provides few levels which are not just leading but also perfect. This script can be used only on the current day/week/month and can't be used to predict the next sessions movement as this script uses current open price.
Open line - Line drawn based on the open of the candle. I feel this is one of the underrated line. This is a very powerful resistance and support line.
Average 10 days levels - These are just calculated based on average 10 previous days.
Logic is - since the script has stayed within the range for past 10 days it remains to stay in the same levels even today.
So on average this levels works 8/10 times which is very bigger in stock market.
Fibonnaci levels zones - This zone is derived from Thomas de-mark book. This is also a simple level where fibonnaci ratio is used to determine the levels from today's open.
Outer levels - They are also same fibonacci levels which are very much respected by all the stocks and indices.
Provided adjustment levels to determine the range for Day/Week/Month.
Added some code from one of my favorite indicator variable moving average. Thanks to the author of the script.
How to trade using this script.
Apply 10 days average and Fibonacci level zones in the chart
Range bound movement
When the stock open. Try to predict from price action whether the stock is going to be in a small range. Then do a strangle of the strikes just outside the zone.
Trending movement
When the stock seems to be little volatile both the levels applied act a good resistance. Take positions once the range in broken or reversal is happening from the level.
This script is unique because these are not drawn levels based on previous day unlike pivot or Fibonacci, current day open is important in this script.
tip - Use it in banknifty and Nifty with Range bound strategy I have mentioned above.
Happy trading.

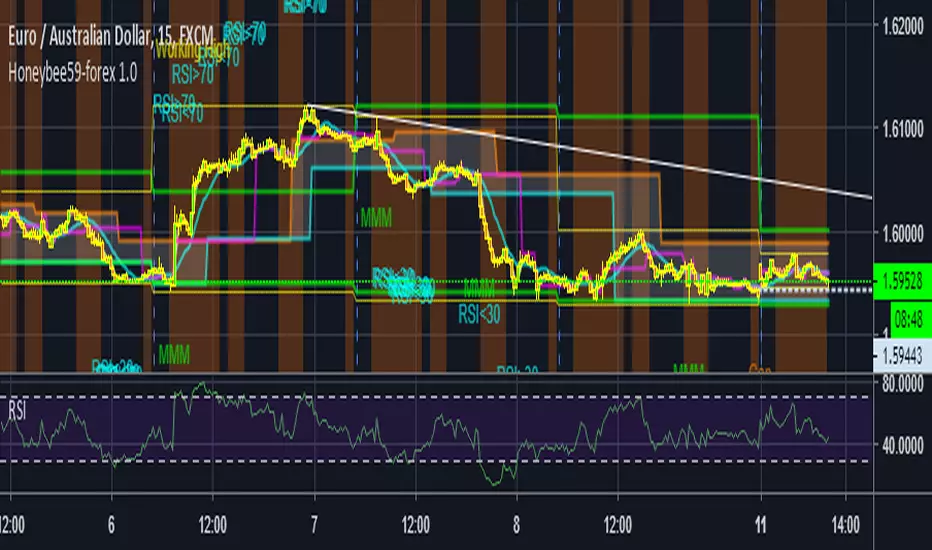
Honeybee59-forex 2.0Honeybee59-forex 2.0 for TradingView gives you abilities to see the stories hiding in the graphs of forex, and crypto currency markets. It counts CC59 and creates respectable support and resistance levels as well as marks and reminds you about important parameters that are happening in the graph so that you will not forget to consider them before placing orders. This set of tools is a simplified version of Graph Reader Pro for TradingView customized for planning your investments in forex. These parameters include:
* Automatic CC59 counting that compares the close of the right price bar to that of left price bar in a group of 5 consecutive bars (ignoring 3 bars in the middle). If the right bar closed higher, the count positive number would be printed above the bar. If the right bar closed lower, the count negative number would be printed below the bar. Nine consecutive series of up counts will define the lowest price as CC59 support light blue line and nine consecutive series of down counts will define the highest price as CC59 resistance orange line. The counted numbers, support and resistance lines are automatically printed on the graph if enabled.
* Draw a reconfigurable simple moving average ( MySMA ) white line. The default setting is SMA3.
* Draw the high and low of the previous day green lines, if enabled. The Previous Day's High and Low are often used as reversal levels in the few future days.
* Draw a popular SMA13 red line.
* Draw a Pullback level pink line near the beginning of a possible new trend.
* Draw High Of the Day and Low of the Day yellow lines for the most recent high and low levels of today.
* Paint the background areas with active Forex trading of Asian, London, and New York sessions, if enabled.
* Print "Working High" and "Working Low" when the price hits previous day's High and Low levels.
* Print "MMM" when there is a possible Market Maker's Manipulation (price bar range is larger than recent average value by a reconfigurable factor, 3 times by default).
* Print "RSI>70" and "RSI<70" for RSI (14) that crosses above 70 % and below 70 %.
* Print "RSI<30" and "RSI>30" for RSI (14) that crosses below 30 % and above 30 %.
* Print "Max" and "Min" for local maximum and local minimum bars.
* Print "Gap" when there is a gap between neighboring price bars. The opened gaps are often closed later on. Hence, they are milestones for the price to come back and close them up.
* Print "MACD>Sig" and "MACDMySMA" and "C Dark".
For free TradingView plan, you can add two more indicators to the chart. That means you may add RSI and MACD indicators with same parameters as those setup in Honeybee59-forex to your graph. DrGraph regularly publishes his educational ideas on using features provided in Honeybee59-forex for profitable investments. You can follow him for how to use the tools in trading forex, and crypto currencies.

Honeybee59-forex 1.0Honeybee59-forex 1.0 for TradingView gives you abilities to see the stories hiding in the graphs of forex, and crypto currency markets. It counts CC59 and creates respectable support and resistance levels as well as marks and reminds you about important parameters that are happening in the graph so that you will not forget to consider them before placing orders. This set of tools is a simplified version of Graph Reader Pro for TradingView customized for planning your investments in stocks. This set of tools is a simplified version of Graph Reader Pro for TradingView customized for planning your investments in forex. These parameters include:
* Automatic CC59 counting that compares the close of the right price bar to that of left price bar in a group of 5 consecutive bars (ignoring 3 bars in the middle). If the right bar closed higher, the count positive number would be printed above the bar. If the right bar closed lower, the count negative number would be printed below the bar. Nine consecutive series of up counts will define the lowest price as CC59 support line and nine consecutive series of down counts will define the highest price as CC59 resistance line. The counted numbers, support and resistance lines are automatically printed on the graph if enabled.
* Draw a reconfigurable simple moving average ( MySMA ) yellow line. The default setting is SMA3.
* Draw the high and low levels of the previous day (green), if enabled. The Previous Day's High and Low are often used as reversal levels in the few future days.
* Draw a popular SMA13 line (light blue).
* Draw a Pullback level line (pink) near the beginning of a possible new trend.
* Draw High Of the Day and Low of the Day (yellow) for the most recent high and low levels of today.
* Paint the background areas with active Forex trading of Asian, London, and New York sessions, if enabled.
* Print "Working High" and "Working Low" when the price hits previous day's High and Low levels.
* Print "MMM" when there is a possible Market Maker's Manipulation (price bar range is larger than recent average value by a reconfigurable factor, 3 times by default).
* Print "RSI>70" and "RSI<70" for RSI(14) that crosses above 70 % and below 70 %.
* Print "RSI<30" and "RSI>30" for RSI(14) that crosses below 30 % and above 30 %.
* Print "Max" and "Min" for local maximum and local minimum bars.
* Print "Gap" when there is a gap between neighboring price bars. The opened gaps are often closed later on. Hence, they are milestones for the price to come back and close them up.
* Print "MACD>Sig" and "MACDMySMA" and "C Dark".
For free TradingView plan, you can add two more indicators to the chart. That means you may add RSI and MACD indicators with same parameters as those setup in Honeybee59-forex to your graph. DrGraph regularly publishes his educational ideas on using features provided in Honeybee59-forex for profitable investments. You can follow him for how to use the tools in trading forex, and crypto currencies.
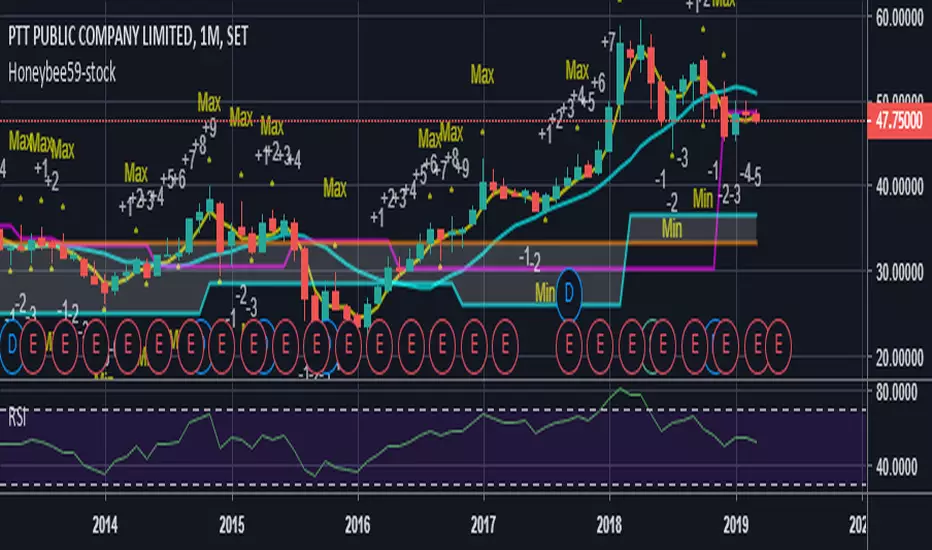
Honeybee59-stock 2.0Honeybee59-stock for TradingView gives you abilities to see the stories hiding in the graphs of stocks. It counts CC59 and creates respectable support and resistance levels as well as marks and reminds you about important parameters that are happening in the graph so that you will not forget to consider them before placing orders. This set of tools is a simplified version of Graph Reader Pro for TradingView customized for planning your investments in stocks.
Features:
*Automatic CC59 counting that compares the close of the right price bar to that of left price bar in a group of 5 consecutive bars (ignoring 3 bars in the middle). If the right bar closed higher, the count positive number would be printed above the bar. If the right bar closed lower, the count negative number would be printed below the bar. Nine consecutive series of up counts will define the lowest price as CC59 support line and nine consecutive series of down counts will define the highest price as CC59 resistance line. The counted numbers, support and resistance lines are automatically printed on the graph if enabled.
* Draw a reconfigurable simple moving average ( MySMA ) yellow line. The default setting is SMA3.
* Draw a popular SMA13 line (light blue).
* Draw a pullback level line (pink) near the beginning of a possible new trend.
* Print "C>MySMA" or "C70" and "RSI<70" for RSI(14) that crosses above 70 % and below 70 %.
* Print "RSI<30" and "RSI>30" for RSI(14) that crosses below 30 % and above 30 %.
* Print "Max" and "Min" for local maximum and local minimum bars.
* Print "Gap" when there is a gap between neighboring price bars. The opened gaps are often closed later on. Hence, they are milestones for the price to come back and close them up.
* Print "MACD>Sig" and "MACD Dark".
For free TradingView plan, you can add two more indicators to the chart. That means you may add RSI and MACD indicators with same parameters as those setup in Honeybee59-stock to your graph. DrGraph regularly publishes his educational ideas on using features provided in Honeybee59-stock for profitable investments. You can follow him for how to use the tools in trading stocks.

Honeybee59-stock
Honeybee59-stock for TradingView gives you abilities to see the stories hiding in the graphs of stocks. It counts CC59 and creates respectable support and resistance levels as well as marks and reminds you about important parameters that are happening in the graph so that you will not forget to consider them before placing orders. This set of tools is a simplified version of Graph Reader Pro for TradingView customized for planning your investments in stocks.
Features:
*Automatic CC59 counting that compares the close of the right price bar to that of left price bar in a group of 5 consecutive bars (ignoring 3 bars in the middle). If the right bar closed higher, the count positive number would be printed above the bar. If the right bar closed lower, the count negative number would be printed below the bar. Nine consecutive series of up counts will define the lowest price as CC59 support line and nine consecutive series of down counts will define the highest price as CC59 resistance line. The counted numbers, support and resistance lines are automatically printed on the graph if enabled.
*Draw a reconfigurable simple moving average (SMA) line.
*Print "Up" or "Down" when the price closes above or below the SMA line.
*Print "Gap" when there is a gap between neighboring price bars. The opened gaps are often closed later on. Hence, they are milestones for the price to come back and close them up.
*Print "RSI>70" and "RSI<70" for RSI (14) that crossed above 70 % and below 70 %.
*Print "RSI<30" and "RSI>30" for RSI (14) that crossed below 30 % and above 30 %.
*Print "MACD>Sig" and "MACD Dark".
For free TradingView plan, you can add two more indicators to the chart. That means you may add RSI and MACD indicators with same parameters as those setup in Honeybee59-stock to your graph. DrGraph regularly publishes his educational ideas on using features provided in Honeybee59-stock for profitable investments. You can follow him for how to use the tools in trading stocks.
Graph Reader Pro 5.0Graph Reader Pro 5.0 for TradingView gives you abilities to see the stories hiding in the graphs of the stock, forex, and crypto currency markets. It counts CC59 and creates respectable support and resistance levels as well as marks and reminds you about important parameters that are happening in the graph so that you will not forget to consider them before placing orders. These parameters include:
Automatic CC59 counting that compares the close of the right price bar to that of left price bar in a group of 5 consecutive bars (ignoring 3 bars in the middle). If the right bar closed higher, the count positive number would be printed above the bar. If the right bar closed lower, the count negative number would be printed below the bar. Nine consecutive series of up counts will define the lowest price as CC59 support line and nine consecutive series of down counts will define the highest price as CC59 resistance line. The counted numbers, support and resistance lines are automatically printed on the graph if enabled.
Draw the high and low levels of the previous day, if enabled. The Previous Day's High and Low are often used as reversal levels in the few future days.
Draw the price range of each day based on Average Daily Range (ADR) value. These lines only show in graphs with less than daily time frames.
Draw the price range of each week based on Average Weekly Range (AWR) value. These lines only show in daily graphs.
Draw simple moving average line SMA3 (yellow), SMA13 (green), SMA50 (pink), and SMA200 (white).
Draw Bollinger bands (50,2) upper and lower lines (pink) with SMA50 as a center line (pink).
Locate the price gaps in the graphs of stocks and indexes. The opened gaps are often closed later on. Hence, they are milestones for the price to come back and close them up.
Paint the background areas with active Forex trading of Asian, London, and New York sessions, if enabled.
Locate an engulfing bar that cover the previous bar with a body portion less than 50% of its range.
Locate an anchor bar that has the range (High - Low) larger than those 14 bars earlier.
Print "RSI>70" and "RSI<70" for RSI(14) that crossed above 70 % and below 70 %.
Print "RSI<30" and "RSI>30" for RSI(14) that crossed below 30 % and above 30 %.
Print "MACD>Sig" and "MACD0" and "MACD<0" for MACD(12,26,9) that crossed above and below zero.
Print "Max" and "Min" for local maximum and local minimum bars.
Print "MA3>13>50" and "MA3<13<50" for ordering of SMA(3,13,50).
Create alarm conditions for the following events that could be set to notify the investor on screen, to an email and to a smart phone:
"Close above MA3"
"Close under MA3"
"Close above MA13"
"Close under MA13"
"Close above MA50"
"Close under MA50"
"Close above MA200"
"Close under MA200"
"MACD up"
"MACD down"
"MACD>Sig"
"MACD0"
"MACD<0"
"MA3 up"
"MA3 down"
"MA13 up"
"MA13 down"
"MA50 up"
"MA50 down"
"CC59 = -1"
"CC59 = +1"
"CC59 = -9"
"CC59 = +9"
"CC59 = -9F"
"CC59 = +9F"
"MA3 < MA13"
"MA3 > MA13"
"MA13 < MA50"
"MA13 > MA50"
"(MA3 < MA13) > MA50"
"MA50 > (MA3 > MA13)"
"MA3 > MA13 > MA50"
"MA3 < MA13 < MA50"
"RSI<30"
"RSI>30"
"RSI<50"
"RSI>50"
"RSI<70"
"RSI>70"
"Hit yesterday's high"
"Hit yesterday's low"
"Hit day open + ADR/2"
"Hit day open"
"Hit day open - ADR/2"
"Hit CC59 resistance"
"Hit CC59 support"
=================================================================================================
The source code of Graph Reader Pro 5.0 custom indicator is protected.
Only invited TradingView members can apply this indicator to their forex, crypto currency and stock price graphs.
Lifetime invitation is for 100 USD with free future upgrades and online supports.
Rental invitation is for 10 USD/month with free future upgrades and online supports.
Paypal, Bank transfer and Bitcoin payments are welcome.
For more informaton please contact the author (DrGraph or Nimit Chomnawang, PhD) via TradingView private chat
or in the comment field below.
=================================================================================================
How to install the script:
------------------------------
*Go to the bottom of this page and click on "Add to Favorite Scripts".
*Remove older version Graph Reader Pro by clicking on the "X" botton behind the indicator line at the top left corner of the chart window.
*Open a new chart at and click on the "Indicators" tab.
*Click on the "Favorites" tab and choose "Graph Reader Pro 5.0".
*Right click anywhere on the graph, choose "Settings".
*In "Style" tab, choose the Dark Theme.
*In "Scales" tab, select Decimal Places = 1/100000.
*In "Background" tab, uncheck "Indicator Arguments" and "Indicator Values".
*In "Timezone/Sessions" tab, choose Time Zone = Your local time.
*At the bottom of settings window, click on "Template", "Save As...", then name this theme of graph setting for future call up such as "Graph Reader Pro".
*Click OK.
*Right click anywhere on the graph, choose "Color Theme => Dark".
For free TradingView plan, you can add two more indicators to the chart. That means you may add RSI and MACD indicators with same parameters as those setup in Graph Reader Pro to your graph. DrGraph regularly publishes his educational ideas on using features provided in Graph Reader Pro for profitable investments. You can follow him for how to use the tools in trading stocks, forex, and binary options.

Graph Reader Pro 4.0Graph Reader Pro 4.0 for TradingView gives you abilities to see the stories hiding in the graphs of the stock, forex, and crypto currency markets. It counts CC59 and creates respectable support and resistance levels as well as marks and reminds you about important parameters that are happening in the graph so that you will not forget to consider them before placing orders. These parameters include:
Automatic CC59 counting that compares the close of the right price bar to that of left price bar in a group of 5 consecutive bars (ignoring 3 bars in the middle). If the right bar closed higher, the count positive number would be printed above the bar. If the right bar closed lower, the count negative number would be printed below the bar. Nine consecutive series of up counts will define the lowest price as CC59 support line and nine consecutive series of down counts will define the highest price as CC59 resistance line. The counted numbers, support and resistance lines are automatically printed on the graph if enabled.
Draw the high and low levels of the previous day, if enabled. The Previous Day's High and Low are often used as reversal levels in the few future days.
Draw the price range of each day based on Average Daily Range (ADR) value. These lines only show in graphs with less than daily time frames.
Draw the price range of each week based on Average Weekly Range (AWR) value. These lines only show in daily graphs.
Draw simple moving average line SMA3, with ability to change the line color based on increasing or decreasing MACD value.
Draw simple moving average line SMA50, with ability to change the line color based on its own increasing or decreasing value.
Locate the price gaps in the graphs of stocks and indexes. The opened gaps are often closed later on. Hence, they are milestones for the price to come back and close them up.
Draw a ribbon of simple moving average lines consisting of SMA3, SMA4, SMA5, SMA6 and SMA7, if enabled. Twisting of the SMA ribbon gives a visual signal for price reversal.
Draw a set of other simple moving average lines such as SMA13, SMA200, SMA800 (if enabled).
Paint the background areas with active Forex trading of Asian, London, and New York sessions, if enabled.
Locate an engulfing bar that cover the previous bar with a body portion less than 50% of its range.
Locate an anchor bar that has the range (High - Low) larger than those 14 bars earlier.
Print "RSI>70" and "RSI<70" for RSI(14) that crossed above 70 % and below 70 %.
Print "RSI<30" and "RSI>30" for RSI(14) that crossed below 30 % and above 30 %.
Print "RSI<50" and "RSI>50" for RSI(14) that crossed below 50 % and above 50 %.
Print "MACD>Sig" and "MACD0" and "MACD<0" for MACD(12,26,9) that crossed above and below zero.
Print "Max" and "Min" for local maximum and local minimum bars.
Print "SMA5>13" and "SMA5<13" for SMA(5) crossed above and below SMA(13).
Print "Highest" and "Lowest" at the highest and lowest prices in a group of configurable number of bars earlier.
=================================================================================================
The source code of Graph Reader Pro 4.0 custom indicator is protected.
Only invited TradingView members can apply this indicator to their forex, crypto currency and stock price graphs.
Lifetime invitation is for 100 USD with free future upgrades and online supports.
Rental invitation is for 10 USD/month with free future upgrades and online supports.
Paypal, Bank transfer and Bitcoin payments are welcome.
For more informaton please contact the author (DrGraph or Nimit Chomnawang, PhD) via TradingView private chat
or in the comment field below.
=================================================================================================
How to install the script:
------------------------------
*Go to the bottom of this page and click on "Add to Favorite Scripts".
*Remove older version Graph Reader Pro by clicking on the "X" botton behind the indicator line at the top left corner of the chart window.
*Open a new chart at and click on the "Indicators" tab.
*Click on the "Favorites" tab and choose "Graph Reader Pro 4.0".
*Right click anywhere on the graph, choose "Settings".
*In "Style" tab, choose the Dark Theme.
*In "Scales" tab, select Decimal Places = 1/100000.
*In "Background" tab, uncheck "Indicator Arguments" and "Indicator Values".
*In "Timezone/Sessions" tab, choose Time Zone = Your local time.
*At the bottom of settings window, click on "Template", "Save As...", then name this theme of graph setting for future call up such as "Graph Reader Pro".
*Click OK.
For free TradingView plan, you can add two more indicators to the chart. That means you may add RSI and MACD indicators with same parameters as those setup in Graph Reader Pro to your graph. DrGraph regularly publishes his educational ideas on using features provided in Graph Reader Pro for profitable investments. You can follow him for how to use the tools in trading stocks, forex, and binary options.

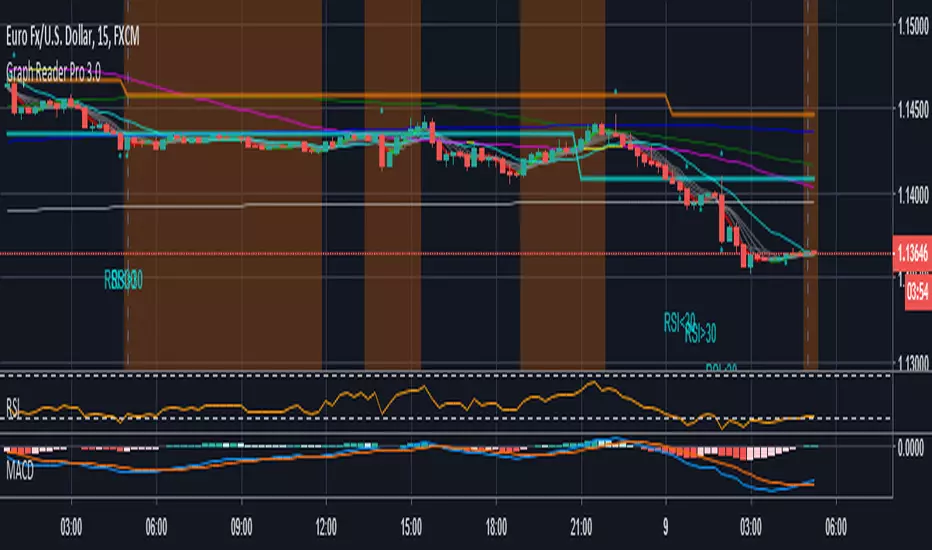
Graph Reader Pro 3.0Graph Reader Pro 3.0 for TradingView gives you abilities to see the stories hiding in the graphs of the stock, forex, and crypto currency markets. It counts CC59 and creates respectable support and resistance levels as well as marks and reminds you about important parameters that are happening in the graph so that you will not forget to consider them before placing orders. These parameters include:
Automatic CC59 counting that compares the close of the right price bar to that of left price bar in a group of 5 consecutive bars (ignoring 3 bars in the middle). If the right bar closed higher, the count positive number would be printed above the bar. If the right bar closed lower, the count negative number would be printed below the bar. Nine consecutive series of up counts will define the lowest price as CC59 support line and nine consecutive series of down counts will define the highest price as CC59 resistance line. The counted numbers, support and resistance lines are automatically printed on the graph if enabled.
Draw the high and low levels of the previous day, if enabled. The Previous Day's High and Low are often used as reversal levels in the few future days.
Draw the price range of each day based on Average Daily Range (ADR) value.
Draw the price range of each week based on Average Weekly Range (AWR) value.
Paint the background areas with active Forex trading of Asian, London, and New York sessions, if enabled.
Draw simple moving average lines such as SMA3, with ability to change the line color based on increasing or decreasing MACD value.
Draw simple moving average lines such as SMA50 with ability to change the line color based on increasing or decreasing prices. A set of other simple moving average lines such as SMA13, SMA200, SMA800 can be drawn if enabled.
Draw a ribbon of simple moving average lines consisting of SMA3, SMA4, SMA5, SMA6 and SMA7, if enabled. Twisting of the SMA ribbon gives a visual signal for price reversal.
Locate the price gaps in the graphs of stocks and indexes. The opened gaps are often closed later on. Hence, they are milestones for the price to come back and close them up.
Locate the pin bars having the body portion less than a specific percent of the range. The pin bars show hestitation for the price to continue the current trend. When a pin bar is covered or engulfed by the next larger bar, a trend reversal offen follows.
Automatic printing of the events happening in the graph to remind the readers of parameters under considerations (if enabled) including:
- Print "C>SMA3" and "C13" and "SMA5<13" for SMA(5) crossed above and below SMA(13).
- Print "Max" and "Min" for local maximum and local minimum bars.
- Print "RSI>70" and "RSI<70" for RSI(14) that crossed above 70 % and below 70 %.
- Print "RSI<30" and "RSI>30" for RSI(14) that crossed below 30 % and above 30 %.
- Print "RSI>50" and "RSI<50" for RSI(14) that crossed above 50 % and below 50 %.
- Print "RSI<50" and "RSI>50" for RSI(14) that crossed below 50 % and above 50 %.
- Print "MACD>0" and "MACD<0" for MACD(12,26,9) that crossed above and below zero.
- Print "MACD>Sig" and "MACD
Graph Reader Pro 2.0Graph Reader Pro 2.0 for TradingView gives you abilities to see the stories hiding in the graphs of the stock, forex, and crypto currency markets. It counts CC59 and creates respectable support and resistance levels as well as marks and reminds you about important parameters that are happening in the graph so that you will not forget to consider them before placing orders. These parameters include:
Automatic CC59 counting that compares the close of the right price bar to that of left price bar in a group of 5 consecutive bars (ignoring 3 bars in the middle). If the right bar closed higher, the count positive number would be printed above the bar. If the right bar closed lower, the count negative number would be printed below the bar. Nine consecutive series of up counts will define the lowest price as CC59 support line and nine consecutive series of down counts will define the highest price as CC59 resistance line. The counted numbers, support and resistance lines are automatically printed on the graph if enabled.
Draw the high and low levels of the previous day, if enabled. The Previous Day's High and Low are often used as reversal levels in the few future days.
Draw the price range of each day based on Average Daily Range (ADR) value.
Paint the background areas with active Forex trading of Asian, London, and New York sessions, if enabled.
Draw simple moving average lines such as SMA5, SMA50 with ability to change the line color based on increasing or decreasing prices. A set of other simple moving average lines such as SMA13, SMA200, SMA800 can be drawn if enabled.
Draw a ribbon of simple moving average lines consisting of SMA3, SMA4, SMA6 and SMA7, if enabled. Twisting of the SMA ribbon gives a visual signal for price reversal.
Locate the price gaps in the graphs of stocks and indexes. The opened gaps are often closed later on. Hence, they are milestones for the price to come back and close them up.
Locate the pin bars having the body portion less than a specific percent of the range. The pin bars show hestitation for the price to continue the current trend. When a pin bar is covered or engulfed by the next larger bar, a trend reversal offen follows.
Draw Bollinger bands (50,2), if enabled.
Automatic printing of the events happening in the graph to remind the readers of parameters under considerations (if enabled) including:
- Print "C>SMA5" and "C13" and "SMA5<13" for SMA(5) crossed above and below SMA(13).
- Print "Max" and "Min" for local maximum and local minimum bars.
- Print "RSI>70" and "RSI<70" for RSI(14) that crossed above 70 % and below 70 %.
- Print "RSI<30" and "RSI>30" for RSI(14) that crossed below 30 % and above 30 %.
- Print "MACD>0" and "MACD<0" for MACD(12,26,9) that crossed above and below zero.
- Print "MACD>Sig" and "MACD

Graph Reader Pro 1.0Graph Reader Pro 1.0 for TradingView gives you abilities to see the stories hiding in the graphs of the stock, forex, and crypto currency markets. It counts CC59 and creates respectable support and resistance levels as well as marks and reminds you about important parameters that are happening in the graph so that you will not forget to consider them before placing orders. These parameters include:
Automatic CC59 counting that compares the close of the right price bar to that of left price bar in a group of 5 consecutive bars (ignoring 3 bars in the middle). If the right bar closed higher, the count positive number would be printed above the bar. If the right bar closed lower, the count negative number would be printed below the bar. Nine consecutive series of up counts will define the lowest price as CC59 support line and nine consecutive series of down counts will define the highest price as CC59 resistance line. The counted numbers, support and resistance lines are automatically printed on the graph if enabled.
Draw simple moving average lines such as SMA5, SMA50 with ability to change the line color based on increasing or decreasing prices. A set of other simple moving average lines such as SMA13, SMA200, SMA800 can be drawn if enabled.
Draw a ribbon of simple moving average lines consisting of SMA2, SMA3, SMA4, SMA6, SMA7 and SMA8, if enabled. Twisting of the SMA ribbon gives a visual signal for price reversal.
Find the locations of price gaps.
Draw Bollinger bands (50,2), if enabled.
Draw the high and low levels of the previous day, if enabled.
Paint the background areas with active Forex trading of Asian, London, and New York sessions, if enabled.
Automatic printing of the events happening in the graph to remind the readers of parameters under considerations (if enabled) including:
- Print "C>SMA5" and "C13" and "SMA5<13" for SMA(5) crossed above and below SMA(13).
- Print "SMA5>50" and "SMA5<50" for SMA(5) crossed above and below SMA(50).
- Print "SMA50>200" and SMA50<200" for SMA(50) crossed above and below SMA(200).
- Print "Max" and "Min" for local maximum and local minimum bars.
- Print "RSI>70" and "RSI<70" for RSI(14) that crossed above 70 % and below 70 %.
- Print "RSI<30" and "RSI>30" for RSI(14) that crossed below 30 % and above 30 %.
- Print "MACD>0" and "MACD<0" for MACD(12,26,9) that crossed above and below zero.
- Print "MACD>Sig" and "MACD

Forex Insight Pro 8.0Forex Insight Pro 8.0 for TradingView gives you abilities to see the stories hiding in the graphs of the stock, forex, and crypto currency markets. It counts CC59 and creates respectable support and resistance levels as well as marks and reminds you about important parameters that are happening on the graph so that you will not forget to consider them before placing orders. These parameters include:
Automatic cc59 counting that compares the close of the right price bar to that of left price bar in a group of 5 consecutive bars (ignoring 3 bars in the middle). If the right bar closed higher, the count positive number would be printed above the bar. If the left bar closed higher, the count negative number would be printed below the bar. Nine consecutive series of up counts will define the lowest price as cc59 support line and nine consecutive series of down counts will define the highest price as cc59 resistance line. The count numbers and support / resistance lines are automatically printed on the graph if enabled.
Draw a set of simple moving average lines such as SMA5, SMA13, SMA50, SMA200, SMA800, if enabled.
Draw a ribbon of simple moving average lines consisting of SMA2, SMA3, SMA4, SMA6, SMA7, SMA8, and SMA9, if enabled. Twisting of the SMA ribbon gives a visual signal for price reversal.
Draw Bollinger bands (50,2), if enabled.
The color of SMA5 line can be set to change based on increasing/decreasing values of itself.
The color of SMA50 line (which is the same as the the middle line of Bollinger band (50,2) ) can be set to change based on increasing/decreasing values of itself, or of the MACD(12,26,9).
Draw the high and low levels of the previous day, if enabled.
Paint the background areas with active forex trading of Asian, London, and New York sessions, if enabled.
Automatic printing of the events happening in the graph to remind the readers of parameters under considerations (if enabled) including:
- Print "SMA5>13" and "SMA5<13" for SMA5 crossed above and below SMA13.
- Print "SMA50>200" and SMA50<200" for SMA50 crossed above and below SMA200.
- Print "Max" and "Min" for local maximum and local minimum bars.
- Print "C75" and "C25" for the bars that closed above 75% and closed below 25% of its ranges.
- Print "C>SMA50" and "C3" and "SMA2<3" for SMA2 crossed above and below SMA3.
- Print "RSI>30" and "RSI<70" for RSI(14) that crossed above 30 % and below 70 %.
- Print "MACD>0" and "MACD<0" for MACD(12,26,9) that crossed above and below zero.
- Print "MACD>Sig" and "MACD

Forex Insight Pro 7.0Forex Insight Pro 7.0 for TradingView gives you abilities to see the stories hiding in the graphs of the markets. It marks and reminds you about important parameters that are happening on the graph so that you will not forget to consider them before placing orders. These parameters include:
Automatic CC(X) counting that compare the close of the right price bar to that of left price bar in a group of X consecutive bars such as CC(5,9) of a group of 5 bars will compare the close price of the right bar to the left bar (ignoring 3 bars in the middle). If the right bar closed higher, the count positive number would be printed above the bar. If the left bar closed higher, the count negative number would be printed below the bar. Nine consecutive series of up counts will define the lowest price as CC(5,9) support line and nine consecutive series of down counts will define the highest price as CC(5,9) resistance line. The count numbers and support / resistance lines are automatically printed on the graph if enabled.
Show a set of simple moving average lines such as SMA5, SMA13, SMA50, SMA200, SMA800, if enabled. The color of SMA50 line (which is the same as the the middle line of Bollinger band (50,2) can be set to change based on increasing/decreasing values of itself, or of the MACD(12,26,9).
Show Bollinger bands (50,2), if enabled.
Show the high and low levels of the previous day, if enabled.
Show the important time areas for Forex trading during Asian, London, and New York sessions, if enabled.
Automatic printing of the events happening in the graph to remind the readers of parameters under considerations (if enabled) including:
- Print "SMA5>13" and "SMA5<13" for SMA5 crossed above and below SMA13.
- Print "SMA50>200" and SMA50<200" for SMA50 crossed above and below SMA200.
- Print "Max" and "Min" for local maximum and local minimum bars.
- Print "C75" and "C25" for the bars that closed above 75% and closed below 25% of its ranges.
- Print "C>SMA50" and "C30" and "RSI<70" for RSI(14) that crossed above 30 % and below 70 %.
- Print "MACD>0" and "MACD<0" for MACD(12,26,9) that crossed above and below zero.
- Print "MACD>Sig" and "MACD
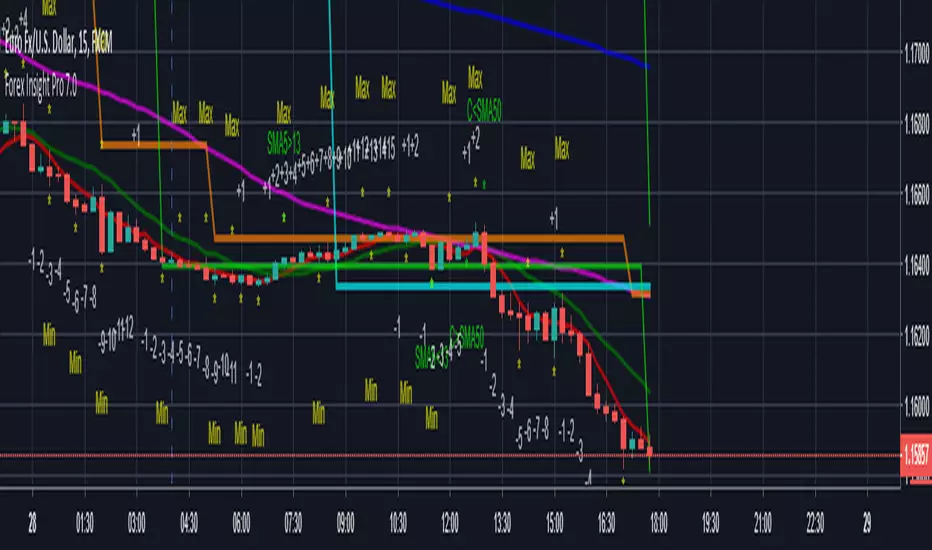
Forex Insight Pro 6.0Forex Insight Pro 6.0 for TradingView gives you abilities to see the stories hiding in the graphs of the markets. It marks and reminds you about important parameters that are happening on the graph so that you will not forget to consider them before placing orders. These parameters include:
Automatic CC(X) counting that compare the close of the right price bar to that of left price bar in a group of X consecutive bars such as CC(5,9) of a group of 5 bars will compare the close price of the right bar to the left bar (ignoring 3 bars in the middle). If the right bar closed higher, the count number would be printed above the bar. If the left bar closed higher, the count number would be printed below the bar. Nine consecutive series of up counts will define the lowest price as CC(5,9) support line and nine consecutive series of down counts will define the highest price as CC(5,9) resistance line. The count numbers and support / resistance lines are automatically printed on the graph if enabled.
Show a set of simple moving average lines such as SMA5, SMA13, SMA50, SMA200, SMA800, if enabled. The color of SMA50 line (which is the same as the the middle line of Bollinger band (50,2) can be set to change based on increasing/decreasing values of itself, or of the MACD(12,26,9).
Show Bollinger bands (50,2), if enabled.
Show the high and low levels of the previous day, if enabled.
Show the important time areas for Forex trading during Asian, London, and New York sessions, if enabled.
Automatic printing of the events happening in the graph to remind the readers of parameters under considerations (if enabled) including:
- Print "SMA5>13" and "SMA5<13" for SMA5 crossed above and below SMA13.
- Print "SMA50>200" and SMA50<200" for SMA50 crossed above and below SMA200.
- Print "Max" and "Min" for local maximum and local minimum bars.
- Print "C75" and "C25" for the bars that closed above 75% and closed below 25% of its ranges.
- Print "C>SMA5" and "C30" and "RSI<70" for RSI(14) that crossed above 30 % and below 70 %.
- Print "MACD>0" and "MACD<0" for MACD(12,26,9) that crossed above and below zero.
- Print "MACD>Sig" and "MACD

Forex Insight Pro 5.0Forex Insight Pro 5.0 for TradingView gives you abilities to see the stories hiding in the graphs of the markets. It marks and reminds you about important parameters that are happening on the graph so that you will not forget to consider them before placing orders. These parameters include:
Automatic CC(X) counting that compare the close of the right price bar to that of left price bar in a group of X consecutive bars such as CC(5,9) of a group of 5 bars will compare the close price of the right bar to the left bar (ignoring 3 bars in the middle). If the right bar closed higher, the count number would be printed above the bar. If the left bar closed higher, the count number would be printed below the bar. Nine consecutive series of up counts will define the lowest price as CC(5,9) support line and nine consecutive series of down counts will define the highest price as CC(5,9) resistance line. The count numbers and support / resistance lines are automatically printed on the graph if enabled.
Show a set of simple moving average lines such as SMA5, SMA13, SMA50, SMA200, SMA800, if enabled. The color of SMA50 line (which is the same as the the middle line of Bollinger band (50,2) can be set to change based on increasing/decreasing values of itself, or of the MACD(12,26,9).
Show Bollinger bands (50,2), if enabled.
Show the high and low levels of the previous day, if enabled.
Show the important time areas for Forex trading during Asian, London, and New York sessions, if enabled.
Automatic printing of the events happening in the graph to remind the readers of parameters under considerations (if enabled) including:
- Print SMA5>13 and SMA5<13 for SMA5 crossed above and below SMA13.
- Print Max and Min for local maximum and local minimum bars.
- Print C75 and C25 for the bars that closed above 75% and closed below 25% of its ranges.
- Print C>SMA5 and C30 and RSI<70 for RSI(14) that crossed above 30 % and below 70 %.
- Print MACD>0 and MACD<0 for MACD(12,26,9) that crossed above and below zero.
- Print MACD>Sig and MACD

Forex Insight Pro 4.0Forex Insight Pro 4.0 for TradingView gives you abilities to see the stories hiding in the graphs of markets. It marks and reminds you about important parameters that are happening on the graph so that you will not forget to consider before placing orders. These parameter include:
Helps you count cc(x) that compares the close price of the last bar to that of x-1 bar earlier (the right most bar and the left most bar of x consecutive bars). It marks a number above the price bar if the close of the right is higher and mark a number below the price bar if the close of the right is lower. A sequence of consecutive numbers from cc(x) counting of x=5 below the price bars up to count number 9 will show exhaustion of downtrend and the highest price among these 9 bars will set a cc(5) resistance line. A sequence of consecutive numbers from cc(x) counting of x=5 above the price bars up to count number 9 will show exhaustion of uptrend and the lowest price among these 9 bars will set a cc(5) support line. Both cc(5) support and resistance lines are often respected by the price actions as reversal levels.
Helps you to notice increment / decrement of Middle line of the Bollinger band indicator or increment/decrement of MACD indicator in colors. The normal Bollinger band indicator will have the gray middle line. You can set its color to blue/pink to reflect increasing/decreasing value of the Bollinger middle line or set its color to lime/red to reflect increasing/decreasing MACD value.
Helps you to notice RSI value when it comes back down from overbought condition by printing "RSI-Dn" above the price bar or when it comes back up from oversold condition by printing "RSI-Up" below the price bar.
Helps you to notice the crossing of MACD line and its smoothing Signal line by printing "MACD > Sig" below the price bar if the MACD line crosses above the Signal line and printing "MACD < Sig" above the price bar if the MACD line crosses below the Signal line. Crossing of MACD and Signal lines could be used as warning signs that the reversal of the price trend might follow in the near future.d as warning signs that the reversal of the price trend might follow in the near future.
Helps you to notice the crossing of MACD line between the positive and negative zones by printing "MACD > 0" below the price bar if the MACD line changes to positive region and printing "MACD < 0" above the price bar if the MACD line crosses into the negative region. Changing the sign of MACD value could be used as warning signs that the reversal of the price trend might follow in the near future.
Helps you to notice the crossing of the fast simple moving average line and slow simple moving average line by printing "F > S" below the price bar if the fast SMA line crosses above the slow SMA line and printing "F < S" above the price bar if the fast SMA line crosses below the slow SMA line. Crossings of fast and slow SMA often indicate reversal of the price trends. the price bar if the fast SMA line crosses below the slow SMA line. Crossings of fast and slow SMA often indicate reversal of the price trends.
Helps you to label the Local Maximum and Local Minimum bars. If the high price of the middle bar inside a group of 3 bars is higher than its left and right neighbors, the label "Max" is printed above that middle price bar. Similarly, the label "Min" is printed below that middle price bar if the low price of it inside a group of 3 bars is lower than those of its left and right neighbors. Local Maximum and Minimum helps a lot in drawing the most recent supply and demand lines in which the price may breakout from.
Helps you to label "C75" to the price bars that close at or above 75% of their own range and label "C25" to the price bars that close at or below 25% of their ow n range. A C75 bar is often followed by an uptrend while a C25 is often followed by a downtrend.
Helps you to see the highest and lowest prices of the previous day. These levels are very important for M and W trading in the time frame smaller than daily graph since both intraday double top and double bottom pattern often appear around the previous day's high and low prices.
Helps you to see the time periods of business hours for people working in the financial markets in Asia, Lodon, and New York. The market prices are active and often provide high opportunities for making profits during these time periods.
Parameters of features in the above list could be changed, or turned on/off easily in the input options of Forex Insight Pro 4.0 custom indicator.
=================================================================================================
The source code of Forex Insight Pro 4.0 custom indicator is protected.
Only invited TradingView members can apply this indicator to their forex, crypto currency and stock price charts.
Lifetime invitation is for 100 USD with free future upgrade and online support.
Rental invitation is for 10 USD/month.
Paypal, bank transfer and Bitcoin payments are welcome.
The author (DrGraph or Nimit Chomnawang, PhD) can be contacted with his TradingView handle.
=================================================================================================
How to install the script:
------------------------------
*Go to the bottom of this page and click on "Add to Favorite Scripts".
*Open a new chart and click on the "Indicators" tab.
*Click on the "Favorites" tab and choose "Forex Insight Pro 4.0".
*Right click anywhere on the graph, choose "Settings".
*In "Style" tab, choose the Dark Theme.
*In "Background" tab, uncheck "Indicator Arguments" and "Indicator Values".
*In "Timezone/Sessions" tab, choose Time Zone = Exchange or your time zone.
*At the bottom of settings window, click on "Template", "SaveAs...", then name this theme of graph setting for future call up such as "Forex Insight Pro".
*Click OK.
For free TradingView plan, you can add two more indicators to the chart. That means you may add RSI or MACD indicators with same parameters as those setup in Forex Insight Pro and Volume indicator to your graph. DrGraph regularly publish his educational idea on using features provided in Forex Insight Pro for profitable investments. You can follow him for how to use the tools.

Laguerre Multi-Filter [DW]This is an experimental study designed to identify underlying price activity using a series of Laguerre Filters.
Two different modes are included within this script:
-Ribbon Mode - A ribbon of 18 Laguerre Filters with separate Gamma values is calculated.
-Band Mode - An average of the 18 filters generates the basis line. Then, Golden Mean ATR over the specified sampling period multiplied by 1 and 2 are added and subtracted to the basis line to generate the bands.
Multi-Timeframe functionality is included. You can choose any timeframe that TradingView supports as the basis resolution for the script.
Custom bar colors are included. Bar colors are based on the direction of any of the 18 filters, or the average filter's direction in Ribbon Mode. In Band Mode, the colors are based solely on the average filter's direction.
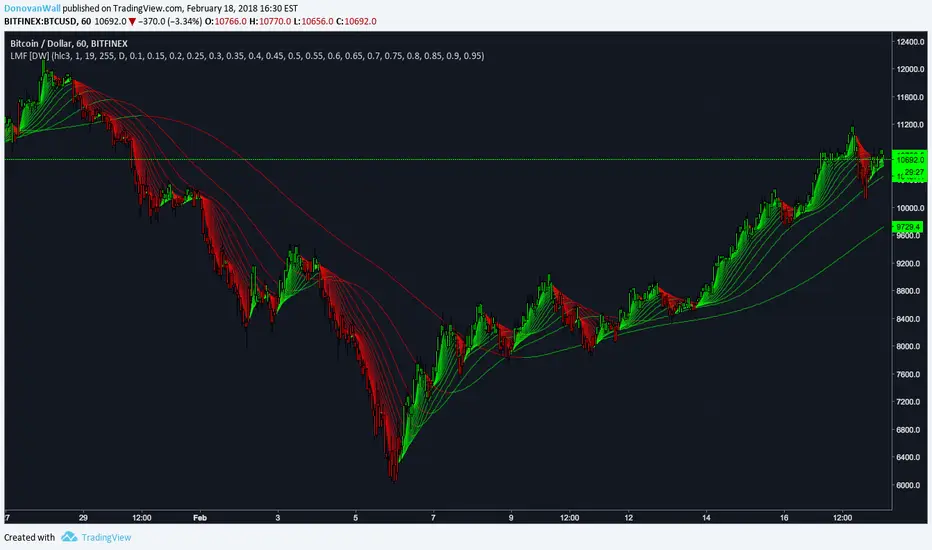
VIX Termstructure Indicator (Overlay)This indicator visualizes the VIX futures term structure directly on your chart background and highlights three key volatility regimes using color coding. It helps identify when the volatility curve is in normal contango, inverted (backwardation), or undergoing a curve flip between the front-month VIX futures.
What the indicator does
The script pulls and compares:
VIX spot index: VIX
Front-month VIX futures: VX1!
Second-month VIX futures: VX2!
All data is requested on the daily timeframe and used to classify the current volatility environment. The indicator then colors the background of your chart according to the detected VIX term structure:
Green background – Contango:
VIX spot is below the front-month futures (VIX < VX1!).
This is typically associated with more “normal” market conditions and lower perceived short-term stress.
Red background – Inverted curve (Backwardation):
VIX spot is above the front-month futures (VIX > VX1!).
This often signals elevated fear, stress, or risk-off conditions in the market.
Yellow background – Curve flip between VX1! and VX2!:
The front-month futures are trading above the second-month futures (VX1! > VX2!).
This can indicate a transition phase in the volatility term structure and may precede or accompany shifts in market sentiment.
How it works
The script fetches the daily close values of VIX, VX1!, and VX2!. It checks whether the front-month futures are above the second-month futures to detect a curve flip. It compares VIX with VX1! to determine if the curve is contango or inverted. Based on these conditions, the chart background is colored with a semi-transparent overlay:
Red has priority when VIX is above VX1! (inverted curve).
If not inverted, yellow is shown when a curve flip VX1! > VX2! is detected.
Otherwise, the background is green (normal contango).
Use cases
This overlay is designed as a context tool for indices, ETFs, Options, or individual stocks that are sensitive to volatility and risk sentiment. Typical applications include:
Identifying periods of heightened risk (red / inverted curve) to adjust position sizing or risk exposure.
Confirming risk-on environments (green / contango) where volatility is more contained.
Monitoring yellow curve-flip phases as potential early warnings of changing volatility regimes.
The indicator does not generate buy/sell signals on its own, but it can be a valuable regime filter or confirmation layer alongside other technical tools.
Notes
This is an overlay indicator: it colors the background of your active chart.
All VIX-related data is evaluated on the daily timeframe, regardless of the chart timeframe.
Make sure that the symbols VIX, VX1!, and VX2! are available on your broker/data feed in TradingView.
Trade History Label Display On Chart (Copy-paste from Rakuten)Overview
This script automatically displays buy/sell labels on the chart simply by copying and pasting your trade history (execution records) exported from Rakuten Securities in Excel format.
It also automatically calculates the profit and loss for each trade.
Background
When reviewing one’s trades, manually matching the broker’s execution records — “date, time, symbol, number of shares, buy or sell” — with the exact points on the chart can be extremely time-consuming.
This is especially inefficient for day traders and scalpers, who may execute dozens of trades per day.
With this script, you can automatically display the entry (IN) and exit (OUT) points on your chart as labels.
It’s also useful when attaching charts to your trading notes or journals, as you can visually confirm exactly where you entered and exited, greatly speeding up the review process.
The script also supports multiple symbols.
Even if you paste a combined dataset containing trades for several stocks, only the trades for the currently displayed symbol will appear automatically.
This allows you to maintain a single master record and instantly visualize the relevant trades just by switching charts.
How to Use
1. Preparing your Excel data
(1)Export trade history
Export your trade history as a CSV file from Rakuten Securities MarketSpeed II, etc.
If you want to include detailed execution times (seconds), make sure to export the data on the same day.
If you export later as a batch, only the date will remain — the time information (hh:mm:ss) will be lost.
(2)Open and format in Excel
Always open the CSV file in Excel — not in Notepad.
If opened in Notepad, double quotes (") will be automatically added, which makes the script unable to recognize the data correctly.
If you need to include seconds in the execution date/time, set a custom format in Excel as follows:
yyyy/mm/dd hh:mm:ss
Copy the range from Execution Date (Column A) to Execution Price (Column L).
Do not include header rows.
Copy data only. Including the header line will cause parsing errors in the script.
(3)If you create a memo column
You can add a Memo column (Column M) next to the “Execution Price” column.
Anything written here (e.g., trade reasoning or notes) will appear on the chart labels.
If you add a memo column, copy the range from Execution Date (A) to Memo (M) when pasting into the script.
Again, copy only the data (not headers). Including column names will cause errors.
2. Paste data into TradingView
Open the script settings and paste the copied data into the text area labeled “Trade Data Paste Area.”
The script automatically parses the text and recognizes date, time, symbol, trade type, position type, credit type, quantity, price, and memo, displaying them as labels at the correct bar.
You can paste data for multiple stocks at once.
Only the rows matching the currently displayed chart’s symbol will be plotted.
3. Display settings (ON/OFF controls)
Each label element (credit type, position type, quantity, memo, etc.) can be turned ON/OFF individually in the script settings via checkboxes (input.bool).
If you’ve created a memo column, its content will also appear on the label.
4. Checking on the chart
Each trade’s entry and exit are shown directly above or below the relevant candlestick.
You can switch between daily and intraday timeframes for more detailed inspection.
Labels are color-coded (e.g., Buy / Sell / Settlement) for quick visual recognition.
When switching symbols, only the relevant trade labels for that symbol will automatically appear.
5. Notes
The script is designed for use on 1-minute to daily charts.
If there’s no matching candlestick for a given trade date/time, the label may not display correctly.
Data input is manual paste only (automatic import not supported).
CSV files must be edited in Excel. Other editors may alter the text format, causing parsing errors.
Due to Pine Script limitations, input.text_area can hold a maximum of 40,960 characters.
The script is tailored for Rakuten Securities’ export format.
Using data from other brokers may require aligning column structures.
If Rakuten changes its export format, the script may need adjustment.
--------------------------------------------------------------------------------------------
概要
このスクリプトは、楽天証券の約定履歴(取引記録)をExcelからコピーして貼り付けるだけで、チャート上に売買ラベルを自動表示するツールです。
また、各取引の損益も自動で計算されます。
背景
自分のトレードを振り返る際、証券会社の約定記録から「何月何日何時何分、どの銘柄を、何株、買った・売った」を確認して、チャート上の位置と突き合わせる作業は非常に時間がかかります。
特にデイトレードやスキャルピングをしていると、1日に数十件以上の約定が発生し、手動で位置を確認するのは非効率です。
このスクリプトを使えば、IN・OUTのタイミングをチャート上にラベルとして自動表示できます。
自分のトレードノート、トレード日記にチャート画像を貼り付ける際も利用 でき、チャートのどこでエントリー/決済したかを視覚的に確認できるため、振り返り作業が大幅に効率化されます。
また、 複数銘柄に対応しており、貼り付けたデータの中から現在表示中のチャート銘柄と一致する売買履歴だけを抽出・表示します。
これにより、複数銘柄分の約定記録を一括管理していても、チャートを切り替えるだけで該当銘柄の取引履歴を瞬時に可視化できます。
使用方法
1. Excelデータの準備
(1)約定履歴のエクスポート
楽天証券マーケットスピードⅡなどから約定履歴をCSV形式でエクスポートします。
約定の詳細な時刻(時分秒単位)データを取得したい場合は、必ず当日中にエクスポートしてください。後日まとめて過去分をエクスポートしても、日付までしか記録されず、時刻情報(hh:mm:ss)は失われます。
(2)Excelで開いて整形
CSVは必ずExcelで開いて編集してください。メモ帳で開くと "(ダブルクォーテーション) が自動的に付与され、スクリプトが正しく認識できません。
約定日の秒単位までを扱いたい場合は、Excelのセル書式設定を開き、「ユーザー定義」で次の形式を新規作成して適用します。書式を変更しないでコピーした場合は分までのデータとなり、スクリプトは00秒と認識します。
yyyy/mm/dd hh:mm:ss
約定日(A列)~約定単価(L列)までのデータ部分をコピーする。
※このとき、項目名(ヘッダー行)は含めず、データ部分のみをコピーしてください。項目名を含めるとスクリプトが誤認識してエラーになります
(3)メモ欄を作成する場合
約定単価の右隣の列(M列)を「メモ欄」として利用できます。ここにエントリー根拠など任意のメモを書いておくとラベル上でもメモを確認できます。
メモ欄を作成した場合は、約定日(A列)からメモ欄(M列)までをコピーして貼り付けてください。
※このとき、項目名(ヘッダー行)は含めず、データ部分のみをコピーしてください。項目名を含めるとスクリプトが誤認識してエラーになります。
2. データをTradingViewに貼り付ける
スクリプトの設定画面を開き、「取引データ貼り付け欄」にExcelからコピーしたデータをそのまま貼り付けます。
スクリプトが自動でテキストを解析し、日付・時刻・銘柄コード・取引区分・建玉区分・信用区分・数量・単価・メモなどを認識して、ラベルをチャート上に自動配置します。
複数銘柄のデータを一度に貼り付けても問題ありません。現在表示中のチャート銘柄と一致する行だけがラベルとして描画されます。
3. 表示設定(ON/OFF切り替え)
各表示要素(信用区分・建玉区分・数量・メモなど)は、設定画面のチェックボックス(input.bool)で個別に表示/非表示を切り替えられます。
メモ欄を作成している場合は、その内容もラベルに表示されます。
4. チャートでの確認
各取引のIN・OUTが、チャート上の該当バー(ローソク足)にラベルとして表示されます。
日足・分足を切り替えることで、より詳細なタイミングを確認できます。
ラベルは、買い(Buy)・売り(Sell)・返済などで色分けされ、視覚的に理解しやすい構成になっています。
チャートを銘柄ごとに切り替えるだけで、その銘柄の取引履歴のみが自動表示されます。
5. 注意点
このスクリプトは 1分足~日足 での使用を想定しています。データ上の日付や時刻に対応するローソク足が存在しない場合、ラベルを正しく表示できません。
データは手動貼り付け方式です。自動取得には対応していません。
Excel以外のアプリで開いたCSVは、文字列形式が変わるため解析できないことがあります。
Pineスクリプトの仕様上、テキストエリアには40,960文字までしか貼り付けできません。
楽天証券の出力フォーマットを想定しているため、他社形式を使う場合は列構成を揃える必要があります。
また、楽天証券の出力フォーマットが変更された場合は、正しく表示出来なります。
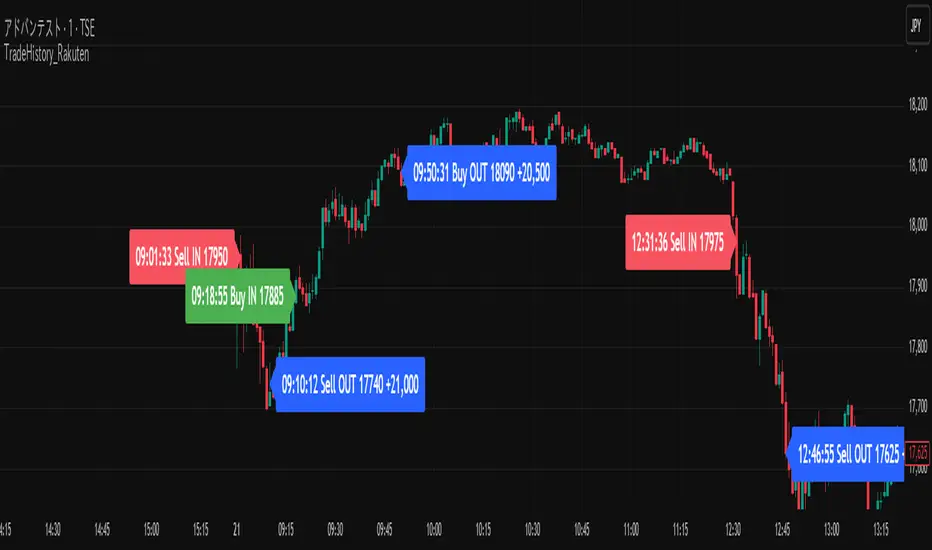
LEGEND IsoPulse Fusion Universal Volume Trend Buy Sell RadarLEGEND IsoPulse Fusion • Universal Volume Trend Buy Sell Radar
One line summary
LEGEND IsoPulse Fusion reads intent from price and volume together, learns which features matter most on your symbol, blends them into a single signed Fusion line in a stable unit range, and emits clear Buy Sell Close events with a structure gate and a liquidity safety gate so you act only when the tape is favorable.
What this script is and why it exists
Many traders keep separate windows for trend, volume, volatility, and regime filters. The result can feel fragmented. This script merges two complementary engines into one consistent view that is easy to read and simple to act on.
LEGEND Tensor estimates directional quality from five causally computed features that are normalized for stationarity. The features are Flow, Tail Pressure with Volume Mix, Path Curvature, Streak Persistence, and Entropy Order.
IsoPulse transforms raw volume into two decaying reservoirs for buy effort and sell effort using body location and wick geometry, then measures price travel per unit volume for efficiency, and detects volume bursts with a recency memory.
Both engines are mapped into the same unit range and fused by a regime aware mixer. When the tape is orderly the mixer leans toward trend features. When the tape is messy but a true push appears in volume efficiency with bursts the mixer allows IsoPulse to speak louder. The outcome is a single Fusion line that lives in a familiar range with calm behavior in quiet periods and expressive pushes when energy concentrates.
What makes it original and useful
Two reservoir volume split . The script assigns a portion of the bar volume to up effort and down effort using body location and wick geometry together. Effort decays through time using a forgetting factor so memory is present without becoming sticky.
Efficiency of move . Price travel per unit volume is often more informative than raw volume or raw range. The script normalizes both sides and centers the efficiency so it becomes signed fuel when multiplied by flow skew.
Burst detection with recency memory . Percent rank of volume highlights bursts. An exponential memory of how recently bursts clustered converts isolated blips into useful context.
Causal adaptive weighting . The LEGEND features do not receive static weights. The script learns, causally, which features have correlated with future returns on your symbol over a rolling window. Only positive contributions are allowed and weights are normalized for interpretability.
Regime aware fusion . Entropy based order and persistence create a mixer that blends IsoPulse with LEGEND. You see a single line rather than two competing panels, which reduces decision conflict.
How to read the screen in seconds
Fusion area . The pane fills above and below zero with a soft gradient. Deeper fill means stronger conviction. The white Fusion line sits on top for precise crossings.
Entry guides and exit guides . Two entry guides draw symmetrically at the active fused entry level. Two exit guides sit inside at a fraction of the entry. Think of them as an adaptive envelope.
Letters . B prints once when the script flips from flat to long. S prints once when the script flips from flat to short. C prints when a held position ends on the appropriate side. T prints when the structure gate first opens. A prints when the liquidity safety flag first appears.
Price bar paint . Bars tint green while long and red while short on the chart to mirror your virtual position.
HUD . A compact dashboard in the corner shows Fusion, IsoPulse, LEGEND, active entry and exit levels, regime status, current virtual position, and the vacuum z value with its avoid threshold.
What signals actually mean
Buy . A Buy prints when the Fusion line crosses above the active entry level while gates are open and the previous state was flat.
Sell . A Sell prints when the Fusion line crosses below the negative entry level while gates are open and the previous state was flat.
Close . A Close prints when Fusion cools back inside the exit envelope or when an opposite cross would occur or when a gate forces a stop, and the previous state was a hold.
Gates . The Trend gate requires sufficient entropy order or significant persistence. The Avoid gate uses a liquidity vacuum z score. Gates exist to protect you from weak tape and poor liquidity.
Inputs and practical tuning
Every input has a tooltip in the script. This section provides a concise reference that you can keep in mind while you work.
Setup
Core window . Controls statistics across features. Scalping often prefers the thirties or low fifties. Intraday often prefers the fifties to eighties. Swing often prefers the eighties to low hundreds. Smaller responds faster with more noise. Larger is calmer.
Smoothing . Short EMA on noisy features. A small value catches micro shifts. A larger value reduces whipsaw.
Fusion and thresholds
Weight lookback . Sample size for weight learning. Use at least five times the horizon. Larger is slower and more confident. Smaller is nimble and more reactive.
Weight horizon . How far ahead return is measured to assess feature value. Smaller favors quick reversion impulses. Larger favors continuation.
Adaptive thresholds . Entry and exit levels from rolling percentiles of the absolute LEGEND score. This self scales across assets and timeframes.
Entry percentile . Eighty selects the top quintile of pushes. Lower to seventy five for more signals. Raise for cleanliness.
Exit percentile . Mid fifties keeps trades honest without overstaying. Sixty holds longer with wider give back.
Order threshold . Minimum structure to trade. Zero point fifteen is a reasonable start. Lower to trade more. Raise to filter chop.
Avoid if Vac z . Liquidity safety level. One point two five is a good default on liquid markets. Thin markets may prefer a slightly higher setting to avoid permanent avoid mode.
IsoPulse
Iso forgetting per bar . Memory for the two reservoirs. Values near zero point nine eight to zero point nine nine five work across many symbols.
Wick weight in effort split . Balance between body location and wick geometry. Values near zero point three to zero point six capture useful behavior.
Efficiency window . Travel per volume window. Lower for snappy symbols. Higher for stability.
Burst percent rank window . Window for percent rank of volume. Around one hundred to three hundred covers most use cases.
Burst recency half life . How long burst clusters matter. Lower for quick fades. Higher for cluster memory.
IsoPulse gain . Pre compression gain before the atan mapping. Tune until the Fusion line lives inside a calm band most of the time with expressive spikes on true pushes.
Continuation and Reversal guides . Visual rails for IsoPulse that help you sense continuation or exhaustion zones. They do not force events.
Entry sensitivity and exit fraction
Entry sensitivity . Loose multiplies the fused entry level by a smaller factor which prints more trades. Strict multiplies by a larger factor which selects fewer and cleaner trades. Balanced is neutral.
Exit fraction . Exit level relative to the entry level in fused unit space. Values around one half to two thirds fit most symbols.
Visuals and UX
Columns and line . Use both to see context and precise crossings. If you present a very clean chart you can turn columns off and keep the line.
HUD . Keep it on while you learn the script. It teaches you how the gates and thresholds respond to your market.
Letters . B S C T A are informative and compact. For screenshots you can toggle them off.
Debug triggers . Show raw crosses even when gates block entries. This is useful when you tune the gates. Turn them off for normal use.
Quick start recipes
Scalping one to five minutes
Core window in the thirties to low fifties.
Horizon around five to eight.
Entry percentile around seventy five.
Exit fraction around zero point five five.
Order threshold around zero point one zero.
Avoid level around one point three zero.
Tune IsoPulse gain until normal Fusion sits inside a calm band and true squeezes push outside.
Intraday five to thirty minutes
Core window around fifty to eighty.
Horizon around ten to twelve.
Entry percentile around eighty.
Exit fraction around zero point five five to zero point six zero.
Order threshold around zero point one five.
Avoid level around one point two five.
Swing one hour to daily
Core window around eighty to one hundred twenty.
Horizon around twelve to twenty.
Entry percentile around eighty to eighty five.
Exit fraction around zero point six zero to zero point seven zero.
Order threshold around zero point two zero.
Avoid level around one point two zero.
How to connect signals to your risk plan
This is an indicator. You remain in control of orders and risk.
Stops . A simple choice is an ATR multiple measured on your chart timeframe. Intraday often prefers one point two five to one point five ATR. Swing often prefers one point five to two ATR. Adjust to symbol behavior and personal risk tolerance.
Exits . The script already prints a Close when Fusion cools inside the exit envelope. If you prefer targets you can mirror the entry envelope distance and convert that to points or percent in your own plan.
Position size . Fixed fractional or fixed risk per trade remains a sound baseline. One percent or less per trade is a common starting point for testing.
Sessions and news . Even with self scaling, some traders prefer to skip the first minutes after an open or scheduled news. Gate with your own session logic if needed.
Limitations and honest notes
No look ahead . The script is causal. The adaptive learner uses a shifted correlation, crosses are evaluated without peeking into the future, and no lookahead security calls are used. If you enable intrabar calculations a letter may appear then disappear before the close if the condition fails. This is normal for any cross based logic in real time.
No performance promises . Markets change. This is a decision aid, not a prediction machine. It will not win every sequence and it cannot guarantee statistical outcomes.
No dependence on other indicators . The chart should remain clean. You can add personal tools in private use but publications should keep the example chart readable.
Standard candles only for public signals . Non standard chart types can change event timing and produce unrealistic sequences. Use regular candles for demonstrations and publications.
Internal logic walkthrough
LEGEND feature block
Flow . Current return normalized by ATR then smoothed by a short EMA. This gives directional intent scaled to recent volatility.
Tail pressure with volume mix . The relative sizes of upper and lower wicks inside the high to low range produce a tail asymmetry. A volume based mix can emphasize wick information when volume is meaningful.
Path curvature . Second difference of close normalized by ATR and smoothed. This captures changes in impulse shape that can precede pushes or fades.
Streak persistence . Up and down close streaks are counted and netted. The result is normalized for the window length to keep behavior stable across symbols.
Entropy order . Shannon entropy of the probability of an up close. Lower entropy means more order. The value is oriented by Flow to preserve sign.
Causal weights . Each feature becomes a z score. A shifted correlation against future returns over the horizon produces a positive weight per feature. Weights are normalized so they sum to one for clarity. The result is angle mapped into a compact unit.
IsoPulse block
Effort split . The script estimates up effort and down effort per bar using both body location and wick geometry. Effort is integrated through time into two reservoirs using a forgetting factor.
Skew . The reservoir difference over the sum yields a stable skew in a known range. A short EMA smooths it.
Efficiency . Move size divided by average volume produces travel per unit volume. Normalization and centering around zero produce a symmetric measure.
Bursts and recency . Percent rank of volume highlights bursts. An exponential function of bars since last burst adds the notion of cluster memory.
IsoPulse unit . Skew multiplied by centered efficiency then scaled by the burst factor produces the raw IsoPulse that is angle mapped into the unit range.
Fusion and events
Regime factor . Entropy order and streak persistence form a mixer. Low structure favors IsoPulse. Higher structure favors LEGEND. The blend is convex so it remains interpretable.
Blended guides . Entry and exit guides are blended in the same way as the line so they stay consistent when regimes change. The envelope does not jump unexpectedly.
Virtual position . The script maintains state. Buy and Sell require a cross while flat and gates open. Close requires an exit or force condition while holding. Letters print once at the state change.
Disclosures
This script and description are educational. They do not constitute investment advice. Markets involve risk. You are responsible for your own decisions and for compliance with local rules. The logic is causal and does not look ahead. Signals on non standard chart types can be misleading and are not recommended for publication. When you test a strategy wrapper, use realistic commission and slippage, moderate risk per trade, and enough trades to form a meaningful sample, then document those assumptions if you share results.
Closing thoughts
Clarity builds confidence. The Fusion line gives a single view of intent. The letters communicate action without clutter. The HUD confirms context at a glance. The gates protect you from weak tape and poor liquidity. Tune it to your instrument, observe it across regimes, and use it as a consistent lens rather than a prediction oracle. The goal is not to trade every wiggle. The goal is to pick your spots with a calm process and to stand aside when the tape is not inviting.

Candle Partition Statistics with IQV and Chi2NOTE: THE FORMULA IN THE CHART IS NOT PART OF THE CODE
This Pine Script calculates statistical measures for candle partitions based on whether a candle is bullish or bearish and whether the price is above or below an EMA. It evaluates statistical properties such as the Index of Qualitative Variation (IQV) and the Chi-Square (χ²) statistic to assess variations in price action.
Concept of Index of Qualitative Variation (IQV)
IQV is a statistical measure used to quantify the diversity or dispersion of categorical variables. In this script, it is used to measure how evenly the four categories of candles (green above EMA, red above EMA, green below EMA, red below EMA) are distributed.
Purpose of IQV in the Script:
IQV ranges from 0 to 1, where 0 indicates no variation (one category dominates) and 1 indicates maximum variation (categories are equally distributed).
A high IQV suggests balanced distributions of bullish/bearish candles above/below the EMA, indicating market uncertainty or mixed sentiment.
A low IQV suggests dominance of a particular candle type, indicating a strong trend.
Concept of Chi-Square (χ²) Test
Chi-square (χ²) is a statistical test that measures the difference between expected and observed frequencies of categorical data. It assesses whether short-term price behavior significantly deviates from historical trends.
Purpose of Chi-Square in the Script:
A high χ² value means that short-term candle distributions are significantly different from historical patterns, indicating potential trend shifts.
If χ² exceeds a predefined significance threshold (chi_threshold), an alert (Chi² Alert!) is triggered.
It helps traders identify periods where recent price behavior deviates from historical norms, possibly signaling trend reversals or market regime changes.
Key Takeaways:
IQV helps measure the diversity of price action, detecting whether the market is balanced or trending.
Chi-square (χ²) identifies significant deviations in short-term price behavior compared to long-term trends.
Both metrics together provide insights into whether the market is stable, trending, or shifting.
The Nasan C-score enhances trend strength by incorporating volatility. It is calculated as:
enhanced_t_s =(𝑡𝑠 × avg_movement x 100)/SMA(𝑐lose)
Key Components:
𝑡𝑠 : Measures trend strength based on price movements relative to EMA.
ts=green_EMAup_a+0.5×red_EMAup_a−(0.5×green_EMAdown_a+red_EMAdown_a)
avg_movement: The SMA of absolute close-open differences, capturing volatility.
Normalization: The division by SMA(close) adjusts the score relative to price levels.
Purpose of the Nasan C-score
Enhanced Trend Strength
It amplifies the trend strength value by factoring in volatility (price movement).
If price volatility is high, trend strength variations have a greater impact.
Volatility-Adjusted Momentum
By scaling 𝑡𝑠 with average movement, the score adjusts to changing price dynamics.
Higher price fluctuations lead to a higher score, making trend shifts more prominent.
How It Can Be Used in Trading
Higher values of Nasan C-score indicate strong bullish or bearish trends.
Comparing it with past values helps determine whether momentum is increasing or fading.
Thresholds can be set to identify significant trend shifts based on historical highs and lows.
